Level:
Correct: 0
Incorrect: 0
Marks: 0/0
Practice
Course:
Topics:
Year 7 Maths Smart practice A mixed round aimed at your weak spots
Unit 1
Place value and the number system
Unit 2
Calculating
Unit 3
Factors, multiples and powers
Unit 4
Fractions
Unit 5
Fractions, decimals and percentages
Unit 6
Algebraic expressions
Unit 7
Equations and inequalities
Unit 8
Sequences and graphs
Unit 9
Ratio and proportion
Ratio, proportion and rates of change
Writing and simplifying ratios
Quick practice5 skills
Sharing in a ratio
Quick practice5 skills
Proportion and best buys
Quick practice5 skills
Scale drawings and maps
Quick practice4 skills
Unit 10
Measures, perimeter, area and volume
Unit 11
Angles and shapes
Unit 12
Probability
Unit 13
Statistics
Avg
score:
–
Topics
done:
0/63

Bar charts, pictograms and line graphs

Practise 27 questions on Bar charts, pictograms and line graphs for Year 7 Maths. Tap or type your answer and find out straight away if you are right, with the Study Helper on hand if you get stuck.

  • 27 questions
  • 1–5 marks each
  • Instant marking
  • No sign-up needed
20 questions, marked as you go

Sample questions with model answers

Here are 4 of the questions in this topic, each with a model answer, an explanation of why it earns the marks and the mark scheme.

Question 1

1 mark

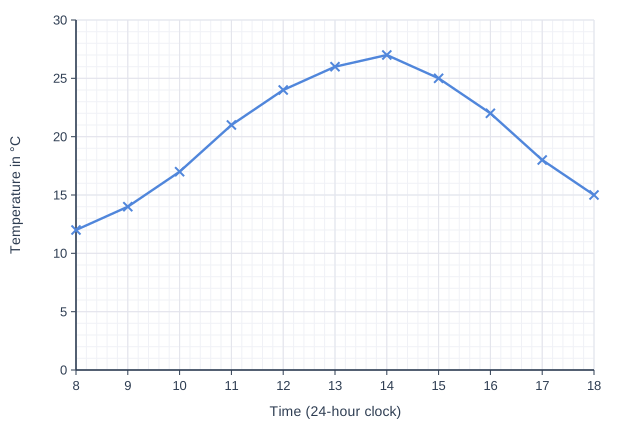
Ruby measured the temperature in a greenhouse every hour during one day. The line graph shows her results.

What was the temperature at 11:00?

Line graph of temperature in °C against time on the 24-hour clock. The horizontal axis is numbered every hour from 8 to 18. The vertical axis goes from 0 to 30, numbered every 5, with 5 small squares between each pair of numbers. A cross is plotted at each hour and the crosses are joined with straight lines. The crosses are at 8: 12, 9: 14, 10: 17, 12: 24, 13: 26, 14: 27, 15: 25, 16: 22, 17: 18 and 18: 15. The cross at 11 is 1 small square above the 20 line.

Model answer

Go up from 11 on the time axis to the line, then across to the temperature axis.
21 °C

Explanation

Find 11 on the time axis, go straight up to the line, then go straight across to the temperature scale. Each small square on the temperature axis is 1 °C, so the reading is 21 °C. Check the scale carefully before you read off any value.

Mark scheme
  1. 1 mark

    21 (°C)

    The unit is not needed.

Question 2

2 marks

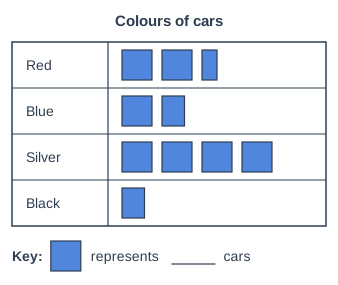
The pictogram shows the colours of the cars in a car park. The number in the key is missing.

There were 20 red cars.

How many silver cars were there?

Pictogram titled "Colours of cars", a table with 4 rows of square symbols. Key: one square represents a number of cars that is left blank. Red: 2 and a half squares. Blue: 1 and three quarters squares. Silver: 4 squares. Black: three quarters of a square.

Model answer

Red has \(2\dfrac{1}{2}\) squares = 20 cars
1 square = \(20 \div 2.5 = 8\) cars
Silver has 4 squares, so \(4 \times 8 = 32\) silver cars

Explanation

Use the row you know to find the key. Red has two and a half squares for 20 cars, so 5 half squares make 20 and one half square is 4 cars. A whole square is therefore 8 cars. Silver has 4 whole squares, which is \(4 \times 8 = 32\) cars.

Mark scheme
  1. 1 mark

    One square represents 8 cars (from \(20 \div 2\dfrac{1}{2}\)); or the correct answer 32 with no working

  2. 1 mark

    32

    Follow through: 4 × their value for one square. A correct answer with no working scores full marks.

Question 3

2 marks

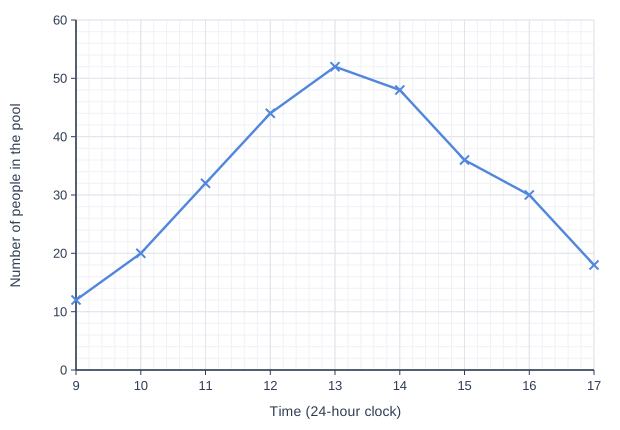
The line graph shows the number of people in a swimming pool at each hour from 9:00 to 17:00 one Saturday.

Which sentence describes how the number of people in the pool changed during the day?

Line graph of number of people in the pool (y-axis, 0 to 60) against time (24-hour clock) (x-axis, 9 to 17). The line joins the points (9, 12), (10, 20), (11, 32), (12, 44), (13, 52), (14, 48), (15, 36), (16, 30), (17, 18).

Model answer

The number of people went up from 12 at 9:00 to a peak of 52 at 13:00. After that it went down, to 18 at 17:00.

Explanation

When you describe a line graph, say which way it goes and where it changes direction. Here the line goes up until 13:00, which is the busiest time, and then comes down for the rest of the afternoon. Giving a value or two, such as the peak of 52 people, makes the description clearer.

Mark scheme
  1. 1 mark

    One correct feature, e.g. 'the number went up in the morning' / 'it went down in the afternoon' / 'the busiest time was 13:00'

  2. 1 mark

    A complete description: the number of people rose from 9:00 to a peak at 13:00 (52 people), then fell until 17:00

    A complete correct description on its own scores both marks. The peak can be given as 13:00 or 1 pm, with or without the value 52. Just listing the values scores 1 at most.

Question 4

4 marks

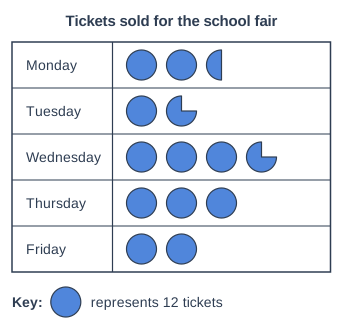
The pictogram shows the number of tickets sold for a school fair on each day of one week.

Each ticket cost £2.

Work out the total amount of money taken from ticket sales.

Pictogram titled "Tickets sold for the school fair", a table with 5 rows of circle symbols. Key: one circle represents 12 tickets. Monday: 2 and a half circles. Tuesday: 1 and three quarters circles. Wednesday: 3 and three quarters circles. Thursday: 3 circles. Friday: 2 circles.

Model answer

One circle = 12 tickets, so a quarter = 3, a half = 6, three quarters = 9
Monday \(2\dfrac{1}{2}\) circles = 30, Tuesday \(1\dfrac{3}{4}\) = 21, Wednesday \(3\dfrac{3}{4}\) = 45, Thursday 3 = 36, Friday 2 = 24
Total tickets = \(30 + 21 + 45 + 36 + 24 = 156\)
Money = \(156 \times 2 = 312\)
£312

Explanation

First use the key: one circle is 12 tickets, so a quarter of a circle is \(12 \div 4 = 3\) tickets. Read each day carefully, add them up to get 156 tickets, then multiply by £2. A quicker way is to count all the circles (13) and multiply by 12. A common mistake is to stop at the number of tickets and forget the money.

Mark scheme
  1. 1 mark

    Uses the key correctly for part circles (a quarter circle is 3 tickets, half a circle is 6, three quarters is 9), with at least three days read correctly: Monday 30, Tuesday 21, Wednesday 45, Thursday 36, Friday 24; or the correct answer £312 with no working

  2. 1 mark

    Total number of tickets: 156

    Also award this mark for 13 circles counted and multiplied by 12.

  3. 1 mark

    Multiplies their total number of tickets by £2

  4. 1 mark

    £312

    Do not accept £156 or £26. A correct answer with no working scores full marks.

Ready to try the rest? Tap or type your answers and see straight away how you did.

Topic notes

Bar charts, pictograms and line graphs

The big idea

Charts turn a table of numbers into a picture, so you can compare things at a glance. Different charts suit different types of data. Before you read any chart, look at its title, its labels and its scale or key, so you know what each square, bar or symbol is worth.

Bar charts and bar-line charts

A bar chart has one bar for each category. The height of each bar is the frequency (how many), which you read off the scale on the vertical axis. To draw a good bar chart:

  1. Draw and label both axes.
  2. Choose a scale that starts at 0, goes up in equal steps and fits the biggest frequency.
  3. Draw the bars all the same width, with equal gaps between them, and give the chart a title.

A dual bar chart (or comparative bar chart) has two bars side by side for each category, such as one for boys and one for girls. A key shows which bar is which, so you can compare the two groups in each category.

A bar-line chart uses thin lines instead of bars. It is used for numbers you count, such as the number of goals scored in each match.

Pictograms

A pictogram uses symbols to show frequencies. The key tells you what one whole symbol stands for, and part of a symbol stands for part of that number.

How many more birds were seen on Wednesday than on Tuesday?

Pictogram titled "Birds seen in a garden", a table with 4 rows of circle symbols. Key: one circle represents 16 birds. Monday: 2 and a half circles = 40 birds. Tuesday: 1 and three quarters circles = 28 birds. Wednesday: 3 and a quarter circles = 52 birds. Thursday: 1 and a half circles = 24 birds. Total of the rows that are drawn: 144 birds.

One circle stands for 16 birds, so half a circle is 8 birds and a quarter of a circle is 4 birds.

Wednesday has 3 whole circles and a quarter: \(3 \times 16 + 4 = 52\) birds.

Tuesday has 1 whole circle and three quarters: three quarters is \(3 \times 4 = 12\), so \(16 + 12 = 28\) birds.

\(52 - 28 = 24\), so 24 more birds were seen on Wednesday.

Line graphs

A line graph shows how something changes over time. Time goes along the horizontal axis. The points are joined with straight lines, and whether the line goes up or down shows the trend.

Mia measured the temperature of a cup of tea every 5 minutes. Use the graph to answer the questions.

Line graph of temperature in °C (y-axis, 0 to 80) against time in minutes (x-axis, 0 to 30). The line joins the points (0, 80), (5, 65), (10, 55), (15, 50), (20, 45), (25, 40), (30, 35).

What was the temperature after 15 minutes? Go up from 15 on the time axis to the line, then across to the temperature axis: 50 °C.

How much did it cool in the first 10 minutes? It started at 80 °C and was 55 °C after 10 minutes: \(80 - 55 = 25\) °C.

Describe the trend. The temperature went down all the time. It fell fastest at the start (15 °C in the first 5 minutes), then more slowly (5 °C every 5 minutes after the first 10 minutes).

Choosing a chart

Type of dataA good chart
categories, such as favourite sportbar chart, pictogram or pie chart
two groups to compare, such as boys and girlsdual bar chart
numbers you count, such as goals in a matchbar chart or bar-line chart
something that changes over timeline graph

A line graph is only for data that changes over time: a line joining "cats" to "dogs" means nothing.

Misleading charts

A chart is misleading if it gives the wrong idea about the data. Watch out for:

  • a vertical axis that does not start at 0, which makes small differences look big;
  • a scale that does not go up in equal steps, such as 0, 10, 20, 50, 100;
  • bars of different widths, or pictogram symbols of different sizes;
  • no labels, no key or no title.

Common mistakes

  • Reading the scale wrongly. On a scale going up in 5s, each small step might be 1, not 5.
  • Counting a part symbol in a pictogram as a whole one, or forgetting to use the key at all.
  • Saying one bar shows "three times as many" because it is three times as tall, when the axis does not start at 0.
  • Using a line graph for categories.

Top tip

Before you read a value, work out what one small square, or one symbol, is worth. Then read across from the top of the bar (or the point on the line) using a ruler.

Study Helper Hints first, answers after you try

Stuck on this one? Ask for a hint and I’ll point you in the right direction, without giving the answer away. Once you’ve checked your answer, I’ll show you how the marks are awarded.