Level:
Correct: 0
Incorrect: 0
Marks: 0/0
Exam Practice
Course:
Topics:
OCR GCSE Maths (Foundation non-calculator) Smart practice A mixed round aimed at your weak spots
Unit 1
Number Operations and Integers
Unit 2
Fractions, Decimals and Percentages
Unit 3
Indices and Surds
Unit 4
Approximation and Estimation
Unit 5
Ratio, Proportion and Rates of Change
Unit 6
Algebra
Unit 7
Graphs of Equations and Functions
Unit 8
Basic Geometry
Unit 9
Congruence and Similarity
Unit 10
Mensuration
Unit 11
Probability
Unit 12
Statistics
Avg
score:
–
Topics
done:
0/100

Scatter graphs, correlation and outliers

Practise 14 exam-style questions on Scatter graphs, correlation and outliers for OCR GCSE Maths (Foundation non-calculator). Write your answer as you would in the exam and get it marked in seconds against the mark scheme, point by point, with the Study Helper on hand if you get stuck.

  • 14 questions
  • 1–4 marks each
  • Instant marking
  • No sign-up needed
14 questions, marked as you go

Sample questions with model answers

Here are 4 of the questions in this topic, each with a model answer, an explanation of why it earns the marks and the mark scheme an examiner would use.

Question 1

1 mark

The scatter graph shows the marks of 12 students in a maths test and in a science test.

Point A shows Ella's marks.

Write down Ella's mark in the science test.
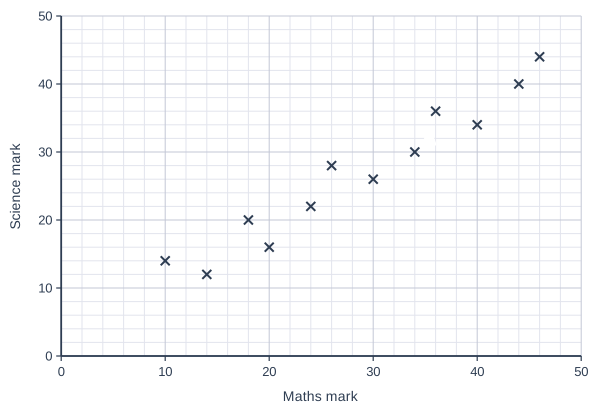
Scatter graph on a grid of small squares. The horizontal axis is "Maths mark", from 0 to 50, numbered every 10, with 5 small squares between numbered values (each small square is 2). The vertical axis is "Science mark", from 0 to 50, numbered every 10, with 5 small squares between numbered values (each small square is 2). 12 points are plotted as crosses: (10, 14), (14, 12), (18, 20), (20, 16), (24, 22), (26, 28), (30, 26), (36, 36), (40, 34), (44, 40) and (46, 44), plus a point labelled A. (The labelled point's coordinates can be read from the grid.)

Model answer

Point A is at (34, 30).
The science mark is on the vertical axis, so Ella's science mark is 30.

Explanation

Each cross shows one student: the horizontal axis gives the maths mark and the vertical axis gives the science mark. Read across from A to the vertical axis. Each small square is 2 marks. A common error is to read the maths mark instead.

Mark scheme
  1. 1 mark

    B1 for 30

    34 (her maths mark) scores 0.
Question 2

2 marks

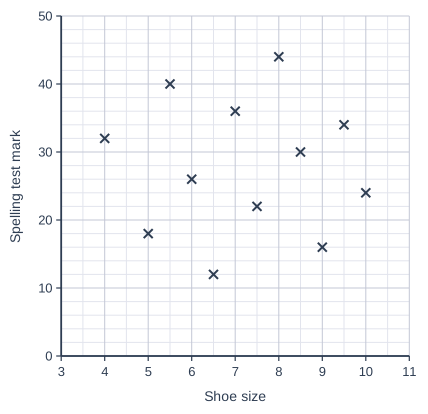
The scatter graph shows the shoe sizes and the marks in a spelling test of 12 students.

What type of correlation, if any, does the scatter graph show?
What does this tell you about shoe size and spelling test mark?

Scatter graph on a grid of small squares. The horizontal axis is "Shoe size", from 3 to 11, numbered every 1, with 2 small squares between numbered values (each small square is 0.5). The vertical axis is "Spelling test mark", from 0 to 50, numbered every 10, with 5 small squares between numbered values (each small square is 2). 12 points are plotted as crosses: (4, 32), (5, 18), (5.5, 40), (6, 26), (6.5, 12), (7, 36), (7.5, 22), (8, 44), (8.5, 30), (9, 16), (9.5, 34) and (10, 24).

Model answer

No correlation.
There is no relationship between a student's shoe size and their spelling test mark: knowing a student's shoe size does not help to predict their mark.

Explanation

The points are scattered all over the graph with no upward or downward pattern, so there is no correlation. This makes sense, because the size of a student's feet has nothing to do with how well they spell.

Mark scheme
  1. 1 mark

    B1 for no correlation

    Accept 'none'. Do not accept 'weak positive' or 'weak negative'; correct answer with no working scores full marks

  2. 1 mark

    B1 for there is no relationship between shoe size and spelling test mark oe

    Accept 'you cannot use shoe size to predict the mark', 'students with bigger feet do not tend to score higher or lower'.

Question 3

2 marks

A study of house fires found strong positive correlation between the number of firefighters sent to a fire and the amount of damage caused by the fire.

Jen says,

'This shows that sending more firefighters causes more damage.'

Explain why Jen is wrong.

Model answer

Correlation does not prove that one thing causes another.
A bigger fire causes more damage, and a bigger fire also needs more firefighters. So both numbers go up because of the size of the fire, not because the firefighters cause the damage.

Explanation

Two variables can be correlated because a third variable affects both of them. Here the size of the fire explains the pattern: big fires get more firefighters and do more damage. Sending fewer firefighters would make the damage worse, not better.

Mark scheme
  1. 1 mark

    B1 for correlation does not show that one thing causes the other oe

    Accept 'correlation is not causation', 'the two are linked but one does not cause the other'.

  2. 1 mark

    B1 for bigger fires need more firefighters and also cause more damage oe

    Must identify the size (or seriousness) of the fire as the reason for both. Accept 'a third factor, the size of the fire, causes both'.

Question 4

4 marks

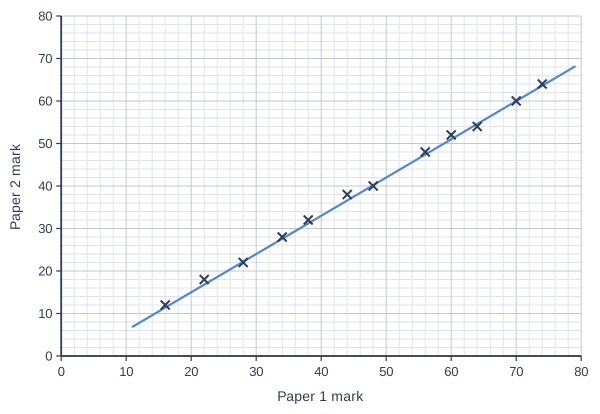
The scatter graph shows the marks of 12 students on Paper 1 and Paper 2 of a test.
Each paper is marked out of 80.
A line of best fit has been drawn.

Ravi scored 50 marks on Paper 1 but missed Paper 2.
His teacher uses the line of best fit to estimate his mark for Paper 2.

To get grade 4, a student needs a total of at least 95 marks on the two papers.

Is Ravi's estimated total enough for grade 4?
Show how you decide.

Scatter graph on a grid of small squares. The horizontal axis is "Paper 1 mark", from 0 to 80, numbered every 10, with 5 small squares between numbered values (each small square is 2). The vertical axis is "Paper 2 mark", from 0 to 80, numbered every 10, with 5 small squares between numbered values (each small square is 2). 12 points are plotted as crosses: (16, 12), (22, 18), (28, 22), (34, 28), (38, 32), (44, 38), (48, 40), (56, 48), (60, 52), (64, 54), (70, 60) and (74, 64). A straight line of best fit is drawn through the points; where it goes can be read from the grid.

Model answer

From the line of best fit, a Paper 1 mark of 50 gives a Paper 2 mark of about 42.
Estimated total = \(50 + 42 = 92\)
92 is less than 95, so Ravi's estimated total is not enough for grade 4.

Explanation

Go up from 50 on the Paper 1 axis to the line and across to the Paper 2 axis. Add this estimate to his Paper 1 mark and compare with 95. This estimate is within the range of the data, so it is reasonable, but it is still only an estimate of what Ravi might have scored.

Mark scheme
  1. 1 mark

    B1 for 42 read from the line at 50

    Accept 40 to 44.

  2. 1 mark

    M1 for \(50 +\) their 42

    Their reading must come from the line at a Paper 1 mark of 50.

  3. 1 mark

    A1 for 92

    Accept 90 to 94 from a reading in the accepted range.

  4. 1 mark

    B1 for No, their total is less than 95

    FT their total. 'No' with no total scores 0.

Ready to try the rest? Every answer you write is marked against the mark scheme, so you can see exactly where the marks are.

Study Helper Hints first, answers after you try

Stuck on this one? Ask for a hint and I’ll point you in the right direction, without giving the answer away. Once you’ve checked your answer, I’ll show you how the marks are awarded.