Level:
Correct: 0
Incorrect: 0
Marks: 0/0
Exam Practice
Course:
Topics:
OCR GCSE Maths (Foundation non-calculator) Smart practice A mixed round aimed at your weak spots
Unit 1
Number Operations and Integers
Unit 2
Fractions, Decimals and Percentages
Unit 3
Indices and Surds
Unit 4
Approximation and Estimation
Unit 5
Ratio, Proportion and Rates of Change
Unit 6
Algebra
Unit 7
Graphs of Equations and Functions
Unit 8
Basic Geometry
Unit 9
Congruence and Similarity
Unit 10
Mensuration
Unit 11
Probability
Unit 12
Statistics
Avg
score:
–
Topics
done:
0/100

Real-life graphs

Practise 17 exam-style questions on Real-life graphs for OCR GCSE Maths (Foundation non-calculator). Write your answer as you would in the exam and get it marked in seconds against the mark scheme, point by point, with the Study Helper on hand if you get stuck.

  • 17 questions
  • 1–4 marks each
  • Instant marking
  • No sign-up needed
17 questions, marked as you go

Sample questions with model answers

Here are 4 of the questions in this topic, each with a model answer, an explanation of why it earns the marks and the mark scheme an examiner would use.

Question 1

1 mark

The graph can be used to convert temperatures between degrees Celsius (°C) and degrees Fahrenheit (°F).

Use the graph to convert 68 °F to °C.
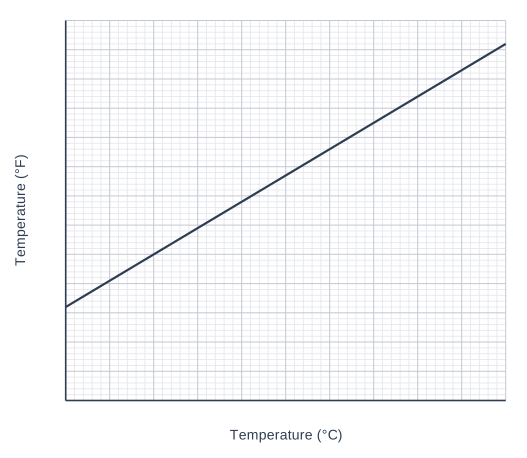
A graph of Temperature (°F) (vertical axis, 0 to 130, marked every 10) against Temperature (°C) (horizontal axis, 0 to 50, marked every 5), on a grid with 5 small squares to each large square. The graph is a straight line; its values can be read from the grid.

Model answer

Go across from 68 on the °F axis to the line, then down to the °C axis.
68 °F = 20 °C

Explanation

The Fahrenheit temperatures are on the vertical axis, so start at 68 on that axis, go across to the line and read down to the Celsius axis. Each small square on the vertical axis is worth 2 °F. A common error is to start at 68 on the wrong axis.

Mark scheme
  1. 1 mark

    B1 for 20

    Accept 19 to 21. Units not required.
Question 2

2 marks

Sam walked from his home to a shop.
He then walked further along the same road to his gran's house.
Later, he walked back home along the same road.

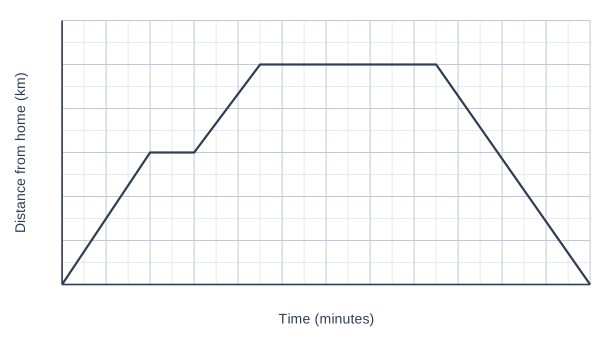
The graph shows Sam's distance from home.

Work out the total distance Sam walked.

A graph of Distance from home (km) (vertical axis, 0 to 3, marked every 0.5) against Time (minutes) (horizontal axis, 0 to 120, marked every 10), on a grid with 2 small squares to each large square. The graph is made of straight-line sections; its values can be read from the grid.

Model answer

Sam's gran's house is 2.5 km from his home.
He walked 2.5 km there (via the shop) and 2.5 km back.
\(2.5 + 2.5 = 5\) km

Explanation

The highest point of the graph shows the furthest distance from home, 2.5 km, which is his gran's house. The shop is on the way, so the walk there is 2.5 km in total, and the walk home is another 2.5 km. A common error is to add the distances read from the vertical axis (1.5 + 2.5) as if they were separate walks.

Mark scheme
  1. 1 mark

    M1 for \(2.5 \times 2\) or \(1.5 + 1 + 2.5\)

    Or M1 for 2.5 (km) identified as the distance from home to his gran's house, with an attempt to add the return journey; correct answer with no working scores full marks

  2. 1 mark

    A1 for 5

    Units not required. 2.5 alone scores 0. 6.5 (from 1.5 + 2.5 + 2.5) scores M0 A0.

Question 3

2 marks

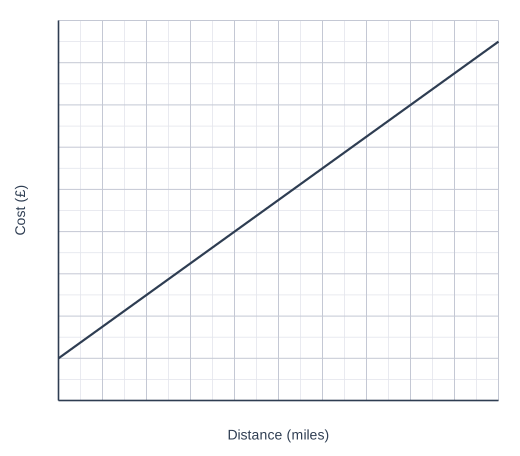
The graph shows the cost of taxi journeys of different distances.

Rob says,

'A 4 mile journey costs £8, so an 8 mile journey will cost £16.'

Is Rob correct?
Show how you decide.

A graph of Cost (£) (vertical axis, 0 to 18, marked every 2) against Distance (miles) (horizontal axis, 0 to 10, marked every 1), on a grid with 2 small squares to each large square. The graph is a straight line; its values can be read from the grid.

Model answer

From the graph, an 8 mile journey costs £14.
£14 is not £16, so Rob is not correct.
The graph starts at £2, not at 0, so doubling the distance does not double the cost.

Explanation

Read the cost for 8 miles from the graph rather than doubling. The line meets the cost axis at £2, which is a fixed charge paid on every journey, so the cost is not directly proportional to the distance. Doubling only works for a straight line through the origin.

Mark scheme
  1. 1 mark

    M1 for reading £14 for 8 miles from the graph

    Accept 13.5 to 14.5. Or M1 for identifying the fixed charge of £2 (where the line meets the cost axis).

  2. 1 mark

    A1 for No, and 8 miles costs £14 (not £16) oe

    Accept 'No, because there is a fixed charge of £2, so the cost is not doubled' or 'the line does not go through the origin, so the cost is not proportional to the distance', with the £14 or £2 seen. 'No' with no correct supporting value scores 0.

Question 4

3 marks

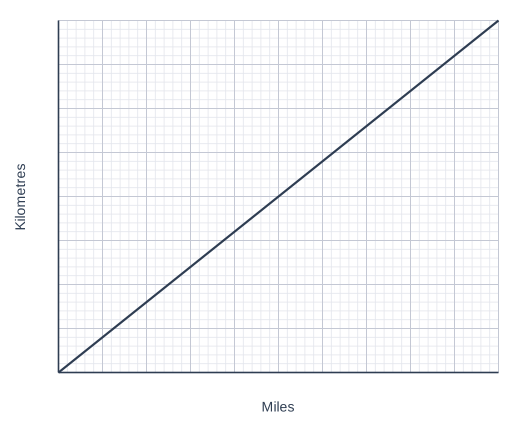
The graph can be used to convert between miles and kilometres.

The speed limit on motorways in France is 130 kilometres per hour.

Jamal is driving on a motorway in France at a speed of 75 miles per hour.

Is Jamal driving faster than the speed limit?
Use the graph to show how you decide.

A graph of Kilometres (vertical axis, 0 to 80, marked every 10) against Miles (horizontal axis, 0 to 50, marked every 5), on a grid with 5 small squares to each large square. The graph is a straight line; its values can be read from the grid.

Model answer

From the graph, 50 miles = 80 km and 25 miles = 40 km.
75 miles = 50 miles + 25 miles
\(80 + 40 = 120\) km
So 75 miles per hour = 120 kilometres per hour.
120 is less than 130, so Jamal is not driving faster than the speed limit.

Explanation

75 miles is off the end of the graph, so split it into parts that can be read, such as 50 + 25, and add the kilometres. Alternatively, convert 130 km to miles and compare with 75. Make sure you compare speeds in the same units, and remember that the graph converts the distances; per hour stays the same.

Mark scheme
  1. 1 mark

    M1 for a correct pair of values read from the graph

    For example 50 miles = 80 km, 25 miles = 40 km, 5 miles = 8 km or 30 miles = 48 km.

  2. 1 mark

    M1 for a complete method to convert 75 miles to km

    For example \(80 + 40\), or \(15 \times 8\), or \(75 \times 1.6\). Alternative method: M1 for a complete method to convert 130 km to miles, e.g. 80 km = 50 miles and 50 km is about 31 miles, so 130 km is about 81 miles (accept 80 to 82).

  3. 1 mark

    A1 for 120 (km/h) and No, he is not driving faster than the limit oe

    Or 130 km/h is about 81 mph (accept 80 to 82) and 75 is less than this, so No. The conclusion must be supported by a correct value. Accept 'he is 10 km/h under the limit'.

Ready to try the rest? Every answer you write is marked against the mark scheme, so you can see exactly where the marks are.

Study Helper Hints first, answers after you try

Stuck on this one? Ask for a hint and I’ll point you in the right direction, without giving the answer away. Once you’ve checked your answer, I’ll show you how the marks are awarded.