
Level:
Correct: 0
Incorrect: 0
Marks: 0/0
Exam Practice
Course:
Topics:
OCR GCSE Maths (Foundation non-calculator) Smart practice A mixed round aimed at your weak spots
Unit 1
Number Operations and Integers
Unit 2
Fractions, Decimals and Percentages
Unit 3
Indices and Surds
Unit 4
Approximation and Estimation
Unit 5
Ratio, Proportion and Rates of Change
Unit 6
Algebra
Unit 7
Graphs of Equations and Functions
Unit 8
Basic Geometry
Unit 9
Congruence and Similarity
Unit 10
Mensuration
Unit 11
Probability
Unit 12
Statistics
Avg
score:
–
Topics
done:
0/100

Comparing data and misleading graphs

Practise 13 exam-style questions on Comparing data and misleading graphs for OCR GCSE Maths (Foundation non-calculator). Write your answer as you would in the exam and get it marked in seconds against the mark scheme, point by point, with the Study Helper on hand if you get stuck.

  • 13 questions
  • 1–4 marks each
  • Instant marking
  • No sign-up needed
13 questions, marked as you go

Sample questions with model answers

Here are 4 of the questions in this topic, each with a model answer, an explanation of why it earns the marks and the mark scheme an examiner would use.

Question 1

1 mark

The table shows information about the numbers of goals scored by two netball players in their matches this season.

Which player's numbers of goals are more consistent?
Give a reason for your answer.
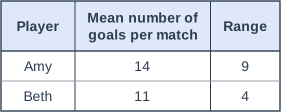
Table with columns "Player", "Mean number of goals per match", "Range". Player: Amy; Mean number of goals per match: 14; Range: 9 | Player: Beth; Mean number of goals per match: 11; Range: 4.

Model answer

Beth. Her range (4) is smaller than Amy's range (9), so her numbers of goals are less spread out and more consistent.

Explanation

Consistency is about spread, so compare the ranges, not the means. A smaller range means the values are closer together. Amy scores more goals on average (higher mean), but Beth is more consistent.

Mark scheme
  1. 1 mark

    B1 for Beth, because her range is smaller oe

    Accept 'Beth, her range is 4 and Amy's is 9', 'Beth's scores are less spread out'. 'Beth' with no reason, or with a reason about the mean, scores 0.

Question 2

2 marks

Here are the marks of 9 students in a test marked out of 20.

3   3   12   14   15   16   17   18   19

Work out the mode.
Explain why the mode is not a good average to describe these marks.

Model answer

The mode is 3, because 3 appears twice and every other mark appears once.
The mode is not a good average because 7 of the 9 students scored 12 or more. A mark of 3 is not typical of the group; the median, 15, describes the marks much better.

Explanation

An average should represent a typical value. Here the most common mark happens to be the lowest mark, only scored by two students. The median or the mean would give a much better idea of how the class did.

Mark scheme
  1. 1 mark

    B1 for mode = 3

  2. 1 mark

    B1 for most of the marks are much higher than 3 / 3 is one of the lowest marks, so it is not typical oe

    Accept 'the mode is the lowest mark', 'the median of 15 is more typical'. Do not accept 'there are two 3s' on its own.

Question 3

2 marks

A newspaper article is about the price of a company's shares.
The article only gives the prices for the last 5 days, when the price fell from 250p to 232p.
The headline says 'Share price crashes!'

One year ago, the price of the shares was 150p.

Explain why the newspaper's article and headline may be misleading.

Model answer

The article only shows 5 days. Over the whole year the price has gone up from 150p to 232p, an increase of 82p.
The fall over the 5 days is only 18p, which is small compared with the price, so 'crashes' is an exaggeration.

Explanation

Statistics can mislead by showing only the part of the data that fits a story. Choosing a short time period hides the longer-term trend, which here is upwards. Always check what time period the figures cover and how big the change really is.

Mark scheme
  1. 1 mark

    B1 for the article only shows a short period of time (5 days) oe

    Accept 'it does not show what happened over the whole year'.

  2. 1 mark

    B1 for over the year the price went up (from 150p to 232p), or the fall is small (18p, about 7%), so it has not crashed oe

    Must give a reason using the numbers or the longer-term increase.

Question 4

4 marks

Kirsty can take two different bus routes to college.
She records her journey times, in minutes, on each route for 7 days.

Route 1:   24   31   27   22   35   26   29
Route 2:   28   30   29   33   27   31   30

Compare the journey times on the two routes.
Use the median and the range.

Model answer

Route 1 in order: 22, 24, 26, 27, 29, 31, 35. Median = 27 minutes, range = \(35 - 22 = 13\) minutes.
Route 2 in order: 27, 28, 29, 30, 30, 31, 33. Median = 30 minutes, range = \(33 - 27 = 6\) minutes.
Route 1 has a lower median, so on average it is quicker.
Route 2 has a smaller range, so its journey times are more consistent.

Explanation

Put each set of times in order to find the medians. Compare an average (which route is quicker) and a measure of spread (which route is more reliable), always saying what the numbers mean in context. Here the routes are better in different ways, so Kirsty's choice depends on whether speed or reliability matters more to her.

Mark scheme
  1. 1 mark

    B1 for Route 1 median = 27

    Ordered: 22, 24, 26, 27, 29, 31, 35; correct answer with no working scores full marks

  2. 1 mark

    B1 for Route 2 median = 30

    Ordered: 27, 28, 29, 30, 30, 31, 33.

  3. 1 mark

    B1 for ranges 13 (Route 1) and 6 (Route 2)

    Both needed.

  4. 1 mark

    B1 for two correct comparisons in context, FT their values

    e.g. 'Route 1 is quicker on average (lower median)' and 'Route 2's times are more consistent (smaller range)'. Both needed.

Ready to try the rest? Every answer you write is marked against the mark scheme, so you can see exactly where the marks are.

Study Helper Hints first, answers after you try

Stuck on this one? Ask for a hint and I’ll point you in the right direction, without giving the answer away. Once you’ve checked your answer, I’ll show you how the marks are awarded.