Level:
Correct: 0
Incorrect: 0
Marks: 0/0
Exam Practice
Course:
Topics:
OCR GCSE Maths (Foundation non-calculator) Smart practice A mixed round aimed at your weak spots
Unit 1
Number Operations and Integers
Unit 2
Fractions, Decimals and Percentages
Unit 3
Indices and Surds
Unit 4
Approximation and Estimation
Unit 5
Ratio, Proportion and Rates of Change
Unit 6
Algebra
Unit 7
Graphs of Equations and Functions
Unit 8
Basic Geometry
Unit 9
Congruence and Similarity
Unit 10
Mensuration
Unit 11
Probability
Unit 12
Statistics
Avg
score:
–
Topics
done:
0/100

Charts, tables and time series graphs

Practise 19 exam-style questions on Charts, tables and time series graphs for OCR GCSE Maths (Foundation non-calculator). Write your answer as you would in the exam and get it marked in seconds against the mark scheme, point by point, with the Study Helper on hand if you get stuck.

  • 19 questions
  • 1–4 marks each
  • Instant marking
  • No sign-up needed
19 questions, marked as you go

Sample questions with model answers

Here are 4 of the questions in this topic, each with a model answer, an explanation of why it earns the marks and the mark scheme an examiner would use.

Question 1

1 mark

The pictogram shows the number of cups of coffee a café sold on Monday, Tuesday and Wednesday.

On Thursday, the café sold 26 cups of coffee.

How many circles are needed for Thursday?
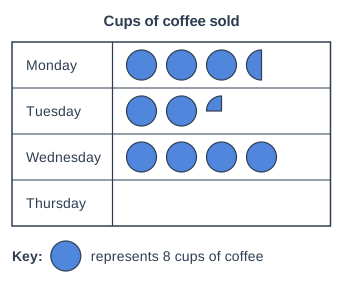
Pictogram titled "Cups of coffee sold", a table with 4 rows of circle symbols. Key: one circle represents 8 cups of coffee. Monday: 3 and a half circles. Tuesday: 2 and a quarter circles. Wednesday: 4 circles. Thursday: blank row (nothing drawn yet).

Model answer

One circle represents 8 cups.
\(26 \div 8 = 3.25\)
3 whole circles and a quarter of a circle are needed.

Explanation

Divide the number of cups by the number each circle represents. 3 circles show 24 cups, and the other 2 cups are a quarter of a circle, because a quarter of 8 is 2. A common error is to work out \(26 \div 4\) or to round to 3 circles.

Mark scheme
  1. 1 mark

    B1 for \(3\dfrac{1}{4}\) (circles)

    Accept 3.25 or 'three and a quarter circles'.
Question 2

2 marks

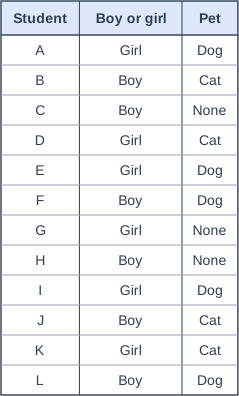
Twelve students were asked whether they own a cat, a dog or no pet.
The table shows their answers.

Neha is going to sort the answers into a two-way table, with one row for boys and one row for girls.

Work out how many girls have a dog and how many boys have no pet.

Table with columns "Student", "Boy or girl", "Pet". Student: A; Boy or girl: Girl; Pet: Dog | Student: B; Boy or girl: Boy; Pet: Cat | Student: C; Boy or girl: Boy; Pet: None | Student: D; Boy or girl: Girl; Pet: Cat | Student: E; Boy or girl: Girl; Pet: Dog | Student: F; Boy or girl: Boy; Pet: Dog | Student: G; Boy or girl: Girl; Pet: None | Student: H; Boy or girl: Boy; Pet: None | Student: I; Boy or girl: Girl; Pet: Dog | Student: J; Boy or girl: Boy; Pet: Cat | Student: K; Boy or girl: Girl; Pet: Cat | Student: L; Boy or girl: Boy; Pet: Dog.

Model answer

Girls with a dog: A, E and I, so 3 girls.
Boys with no pet: C and H, so 2 boys.
The two-way table would be:
Girls: Cat 2, Dog 3, None 1
Boys: Cat 2, Dog 2, None 2

Explanation

A two-way table sorts the data by two things at once, here boy or girl and type of pet. Go through the list one student at a time and put each one in the correct cell. Check that the six cells add up to 12.

Mark scheme
  1. 1 mark

    B1 for girls with a dog: 3

    Students A, E and I; correct answer with no working scores full marks

  2. 1 mark

    B1 for boys with no pet: 2

    Students C and H.

Question 3

2 marks

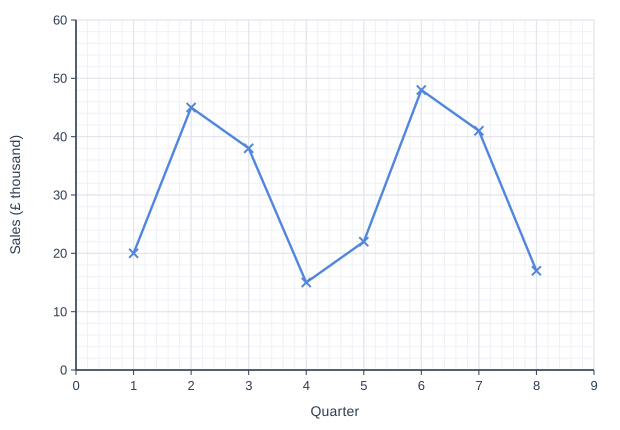
The graph shows the sales of a garden centre in each quarter of 2024 and 2025.
Quarter 1 is January to March 2024, quarter 2 is April to June 2024, and so on. Quarter 5 is January to March 2025.

In which months of the year are the garden centre's sales highest?
Suggest a reason for this.

Line graph of sales (£ thousand) (y-axis, 0 to 60) against quarter (x-axis, 0 to 9). The line joins the points (1, 20), (2, 45), (3, 38), (4, 15), (5, 22), (6, 48), (7, 41), (8, 17).

Model answer

The highest points are quarter 2 (£45 000) and quarter 6 (£48 000), which are both April to June.
This is spring, when many people buy plants and work in their gardens.

Explanation

The graph rises and falls in the same pattern each year: this is a seasonal pattern. The peaks are in the second quarter of each year, and the lowest sales are in October to December. Think about why people might buy more garden products at that time of year.

Mark scheme
  1. 1 mark

    B1 for April to June oe

    Accept 'quarter 2 and quarter 6', 'the second quarter of each year', 'spring'. Do not accept quarter 6 alone, or July to September; correct answer with no working scores full marks

  2. 1 mark

    B1 for a sensible reason, e.g. it is spring, when people plant flowers and work in their gardens oe

    Accept 'the weather is warmer so more people do gardening', 'plants grow in spring'. The reason must relate to the time of year.

Question 4

3 marks

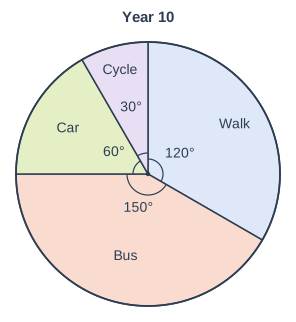
The pie chart shows how the 120 students in Year 10 travel to school.

There are 100 students in Year 11.
35 of the Year 11 students walk to school.

Are more students in Year 10 or in Year 11 walking to school?
Show how you decide.

Year 10. Pie chart. A circle divided into sectors, drawn clockwise from the top (12 o'clock): Walk, 120° (printed); Bus, 150° (printed); Car, 60° (printed); Cycle, 30° (printed). Each printed angle is marked with a small arc at the centre.

Model answer

Year 10: the walk sector is 120°.
\(\dfrac{120}{360} \times 120 = \dfrac{1}{3} \times 120 = 40\) students walk.
Year 11: 35 students walk.
40 is more than 35, so more students in Year 10 walk to school.

Explanation

Convert the angle into a number of students: 120° is one third of 360°, so one third of the 120 students walk. Compare this number with 35. Note that a smaller proportion of Year 10 walk (a third, compared with 35% of Year 11), but there are more Year 10 students, so more of them walk.

Mark scheme
  1. 1 mark

    M1 for \(\dfrac{120}{360} \times 120\) oe

    Or \(360 \div 120 = 3\) degrees per student, then \(120 \div 3\).

  2. 1 mark

    A1 for 40

    The number of Year 10 students who walk.

  3. 1 mark

    B1 for Year 10, with 40 and 35 compared

    FT their 40 compared with 35. Comparing percentages (33% and 35%) and choosing Year 11 scores 0 for this mark: the question asks which year group has more students walking.

Ready to try the rest? Every answer you write is marked against the mark scheme, so you can see exactly where the marks are.

Study Helper Hints first, answers after you try

Stuck on this one? Ask for a hint and I’ll point you in the right direction, without giving the answer away. Once you’ve checked your answer, I’ll show you how the marks are awarded.