Level:
Correct: 0
Incorrect: 0
Marks: 0/0
Exam Practice
Course:
Topics:
OCR GCSE Maths (Foundation non-calculator) Smart practice A mixed round aimed at your weak spots
Unit 1
Number Operations and Integers
Unit 2
Fractions, Decimals and Percentages
Unit 3
Indices and Surds
Unit 4
Approximation and Estimation
Unit 5
Ratio, Proportion and Rates of Change
Unit 6
Algebra
Unit 7
Graphs of Equations and Functions
Unit 8
Basic Geometry
Unit 9
Congruence and Similarity
Unit 10
Mensuration
Unit 11
Probability
Unit 12
Statistics
Avg
score:
–
Topics
done:
0/100

Averages and measures of spread

Practise 19 exam-style questions on Averages and measures of spread for OCR GCSE Maths (Foundation non-calculator). Write your answer as you would in the exam and get it marked in seconds against the mark scheme, point by point, with the Study Helper on hand if you get stuck.

  • 19 questions
  • 1–4 marks each
  • Instant marking
  • No sign-up needed
19 questions, marked as you go

Sample questions with model answers

Here are 4 of the questions in this topic, each with a model answer, an explanation of why it earns the marks and the mark scheme an examiner would use.

Question 1

1 mark

The table shows the number of pets owned by each student in a class.

Write down the mode.
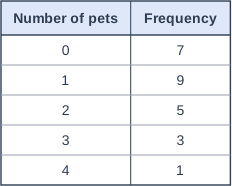
Table with columns "Number of pets", "Frequency". Number of pets: 0; Frequency: 7 | Number of pets: 1; Frequency: 9 | Number of pets: 2; Frequency: 5 | Number of pets: 3; Frequency: 3 | Number of pets: 4; Frequency: 1.

Model answer

The highest frequency is 9, for 1 pet.
The mode is 1 pet.

Explanation

In a frequency table, the mode is the value with the highest frequency. The highest frequency is 9, and it belongs to 1 pet, so the mode is 1. A common error is to give the highest frequency, 9, as the mode.

Mark scheme
  1. 1 mark

    B1 for 1

    9 (the highest frequency) scores 0.
Question 2

2 marks

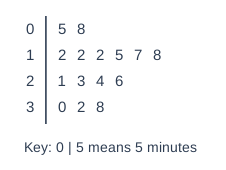
The stem-and-leaf diagram shows the times, in minutes, that 15 students take to walk to school.

Write down the mode.
Work out the range.

Stem and leaf diagram. Key: 0 | 5 means 5 minutes. Rows (stem | leaves): 0 | 5 8; 1 | 2 2 2 5 7 8; 2 | 1 3 4 6; 3 | 0 2 8.

Model answer

The leaf 2 appears three times on the stem 1, so 12 appears three times.
Mode = 12 minutes
Range = \(38 - 5 = 33\) minutes

Explanation

Use the key to read the values: the stem gives the tens and the leaf gives the units. 12 is the only value that appears three times, so it is the mode. The smallest value is 5 (stem 0, leaf 5) and the largest is 38. A common error is to read only the leaf, or to give the range as the difference between stems.

Mark scheme
  1. 1 mark

    B1 for mode = 12

    Do not accept 2 (the leaf) on its own; correct answer with no working scores full marks

  2. 1 mark

    B1 for range = 33

    From \(38 - 5\).

Question 3

2 marks

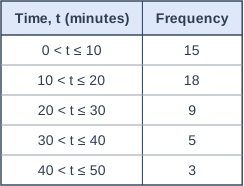
The table shows information about the times, \(t\) minutes, that 50 customers waited in a queue at a bank.

Raj says,

'The median time is in the class \(20 < t \leqslant 30\), because that is the middle class.'

Is Raj correct?
Show how you decide.

Table with columns "Time, t (minutes)", "Frequency". Time, t (minutes): 0 < t ≤ 10; Frequency: 15 | Time, t (minutes): 10 < t ≤ 20; Frequency: 18 | Time, t (minutes): 20 < t ≤ 30; Frequency: 9 | Time, t (minutes): 30 < t ≤ 40; Frequency: 5 | Time, t (minutes): 40 < t ≤ 50; Frequency: 3.

Model answer

There are 50 customers, so the median is between the 25th and 26th values.
Running totals: 15, 33, 42, 47, 50
The 16th to 33rd values are in the class \(10 < t \leqslant 20\), so the 25th and 26th values are in this class.
The median is in \(10 < t \leqslant 20\), so Raj is not correct.

Explanation

The median is the middle customer, not the middle class. Add up the frequencies class by class until you pass the 25th and 26th customers. Most customers waited a short time, so the median is in an earlier class than the middle one.

Mark scheme
  1. 1 mark

    M1 for running totals 15, 33, ... or for identifying the 25th and 26th values (or 25.5th)

    Any correct method that locates the middle of the 50 values.

  2. 1 mark

    A1 for No, the median is in \(10 < t \leqslant 20\)

    'No' with no correct class scores 0.

Question 4

3 marks

The table shows the number of goals a hockey team scored in each of 20 matches.

Tom works out the mean number of goals per match.
Here is his working.

\((0 + 1 + 2 + 3 + 4) \div 5 = 2\)

Explain Tom's mistake.
Work out the correct mean.

Table with columns "Number of goals", "0", "1", "2", "3", "4". Number of goals: Frequency; 0: 4; 1: 5; 2: 6; 3: 3; 4: 2.

Model answer

Tom has found the mean of the numbers 0 to 4. He has not used the frequencies, so he has not found the mean for the 20 matches.
Total goals = \(0 \times 4 + 1 \times 5 + 2 \times 6 + 3 \times 3 + 4 \times 2 = 0 + 5 + 12 + 9 + 8 = 34\)
Mean = \(34 \div 20 = 1.7\)

Explanation

The table summarises 20 matches. The total number of goals is found by multiplying each number of goals by how many matches it happened in, and the mean is this total divided by the number of matches, 20. Tom's method would give the same answer for any frequencies, which shows it cannot be right.

Mark scheme
  1. 1 mark

    B1 for he has not used the frequencies / he should multiply each number of goals by its frequency and divide by 20 oe

    Accept 'he found the mean of 0, 1, 2, 3, 4 instead of the mean of the 20 matches', 'he should divide by 20 not 5' with a reference to the frequencies.

  2. 1 mark

    M1 for \((0 \times 4 + 1 \times 5 + 2 \times 6 + 3 \times 3 + 4 \times 2) \div 20\)

    Implied by \(34 \div 20\).

  3. 1 mark

    A1 for 1.7

    A correct mean of 1.7 with no working scores M1 A1.

Ready to try the rest? Every answer you write is marked against the mark scheme, so you can see exactly where the marks are.

Study Helper Hints first, answers after you try

Stuck on this one? Ask for a hint and I’ll point you in the right direction, without giving the answer away. Once you’ve checked your answer, I’ll show you how the marks are awarded.