
Level:
Correct: 0
Incorrect: 0
Marks: 0/0
Exam Practice
Course:
Topics:
Edexcel GCSE Statistics (Higher Paper 2) Smart practice A mixed round aimed at your weak spots
Unit 1
The statistical enquiry cycle
Statistical enquiry cycle stages 1 and 2; (a) Planning: 1a.01, 1a.02, 1a.03
Statistical enquiry cycle: planning and collecting
Statistical enquiry cycle stages 3, 4 and 5
Statistical enquiry cycle: interpreting and evaluating
Unit 2
The collection of data
(b) Types of data: 1b.01, 1b.02, 1b.03
Types of data and variables
(b) Types of data: 1b.04; (d) Collecting data: 1d.01, 1d.02
Primary and secondary data, reliability and validity
(c) Population and sampling: 1c.01, 1c.02, 1c.03
Populations, sampling frames and non-random sampling
(c) Population and sampling: 1c.04, 1c.05
Random and systematic sampling
(c) Population and sampling: 1c.06
Stratified sampling
(d) Collecting data: 1d.05, 1d.06
Problems with collected data and cleaning data
Unit 3
Processing, representing and analysing data
(a) Tabulation, diagrams and representation: 2a.01
Tabulation, tallies, pictograms and two-way tables
(a) Tabulation, diagrams and representation: 2a.01, 2a.02
Pie charts and comparative pie charts
(a) Tabulation, diagrams and representation: 2a.01
Stem and leaf diagrams
(a) Tabulation, diagrams and representation: 2a.02
Population pyramids, choropleth maps and 2D and 3D diagrams
(a) Tabulation, diagrams and representation: 2a.04
Histograms and frequency density
(a) Tabulation, diagrams and representation: 2a.05, 2a.06, 2a.07, 2a.08
Choosing representations and misleading diagrams
(a) Tabulation, diagrams and representation: 2a.09, 2a.10
Skewness
(b) Measures of central tendency: 2b.01, 2b.02, 2b.03
Mode, median and mean
(b) Measures of central tendency: 2b.01
Weighted mean and geometric mean
(c) Measures of dispersion: 2c.01, 2c.06
Standard deviation and standardised scores
(a) Tabulation, diagrams and representation: 2a.03; (c) Measures of dispersion: 2c.02, 2c.03
Box plots and outliers
(b) Measures of central tendency: 2b.03; (c) Measures of dispersion: 2c.04, 2c.05
Comparing distributions
(d) Further summary statistics: 2d.01
Index numbers
(d) Further summary statistics: 2d.02
Rates of change
(e) Scatter diagrams and correlation: 2e.01, 2e.02, 2e.03
Scatter diagrams, correlation and causation
(e) Scatter diagrams and correlation: 2e.04
Lines of best fit and regression lines
(e) Scatter diagrams and correlation: 2e.05, 2e.06, 2e.07, 2e.08
Spearman's rank and product moment correlation coefficients
(f) Time series: 2f.01, 2f.02; (b) 2b.01 mean seasonal variation
Time series, moving averages and seasonal variation
(g) Quality assurance: 2g.01, 2g.02
Quality assurance and control charts
(h) Estimation: 2h.01, 2h.02, 2h.03
Estimation, sample size and capture-recapture
Unit 4
Probability
3. Probability: 3p.01, 3p.02, 3p.03, 3p.04
Probability, expected frequency and risk
3. Probability: 3p.05, 3p.06, 3p.10
Experimental and theoretical probability and bias
3. Probability: 3p.11
Binomial distribution
3. Probability: 3p.12, 3p.13
Normal distribution
Avg
score:
–
Topics
done:
0/40

Types of data and variables

Practise 14 exam-style questions on Types of data and variables for Edexcel GCSE Statistics (Higher Paper 2). Write your answer as you would in the exam and get it marked in seconds against the mark scheme, point by point, with the Study Helper on hand if you get stuck.

  • 14 questions
  • 1–5 marks each
  • Instant marking
  • No sign-up needed
14 questions, marked as you go

Sample questions with model answers

Here are 4 of the questions in this topic, each with a model answer, an explanation of why it earns the marks and the mark scheme an examiner would use.

Question 1

1 mark

The table shows the masses, \(m\) kg, of 80 suitcases checked in for a flight.

Which of these can be found exactly from the table?

Choose your answer.

  • the mean mass
  • the median mass
  • the mass of the heaviest suitcase
  • the number of suitcases heavier than 20 kg
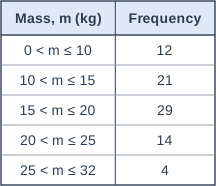
Table with columns "Mass, m (kg)", "Frequency". Mass, m (kg): 0 < m ≤ 10; Frequency: 12 | Mass, m (kg): 10 < m ≤ 15; Frequency: 21 | Mass, m (kg): 15 < m ≤ 20; Frequency: 29 | Mass, m (kg): 20 < m ≤ 25; Frequency: 14 | Mass, m (kg): 25 < m ≤ 32; Frequency: 4.

Model answer

the number of suitcases heavier than 20 kg

Explanation

Grouping data into class intervals loses the individual values. Totals of whole classes can still be found exactly (here 14 + 4 = 18 suitcases were heavier than 20 kg, because 20 is a class boundary), but the mean, the median and the heaviest mass can only be estimated or bounded.

Mark scheme
  1. 1 mark

    B1 for 'the number of suitcases heavier than 20 kg'

    Accept any clear indication of this option (e.g. 'the last one'). More than one option chosen scores B0. 20 kg is a class boundary, so the number is \(14 + 4 = 18\) exactly. Once the masses are grouped, the exact values are lost: the mean and the median can only be estimated, and the heaviest mass is only known to be in the class \(25 < m \le 32\).
Question 2

2 marks

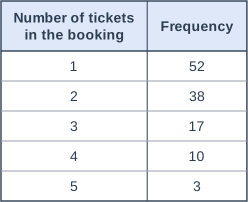
A cinema recorded the number of tickets bought in each of 120 online bookings for a film. The table shows the results.

Tom says, 'The data in the table are grouped data.'

Is Tom correct? Give a reason for your answer.
Write down one other statistical word that describes these data.

Table with columns "Number of tickets in the booking", "Frequency". Number of tickets in the booking: 1; Frequency: 52 | Number of tickets in the booking: 2; Frequency: 38 | Number of tickets in the booking: 3; Frequency: 17 | Number of tickets in the booking: 4; Frequency: 10 | Number of tickets in the booking: 5; Frequency: 3.

Model answer

No. Each possible number of tickets has its own row, so the values have not been put into class intervals. This is an ungrouped frequency table.
The data are discrete (the number of tickets is counted).

Explanation

Grouped data are put into class intervals (such as 1-3 and 4-6), so the individual values are lost. Here every value has its own frequency, so nothing has been lost: the data are ungrouped, and because they are counts they are also discrete and quantitative.

Mark scheme
  1. 1 mark

    B1 for no, each value (1, 2, 3, 4 or 5 tickets) has its own row, so the data have not been grouped into class intervals (they are ungrouped)

    oe. Accept 'it is an ungrouped frequency table'. A decision of 'no' with no reason scores B0. B0 for 'yes'.

  2. 1 mark

    B1 for discrete (or quantitative)

    Accept 'numerical'. B0 for 'continuous', 'qualitative', 'categorical' or 'bivariate'. B0 for 'raw' (the data have been put into a frequency table). Ignore 'ungrouped' if a correct word is also given. This mark is independent of the first mark.

Question 3

2 marks

A ski resort records the depth of snow, in cm, and the number of lift passes sold on each day of the season.
The manager thinks that more lift passes are sold on days when the snow is deeper.

Zoe says, 'The depth of snow cannot be the explanatory variable, because the resort cannot control how much snow there is.'

Explain why Zoe is wrong.
Which variable should be plotted on the horizontal axis of a scatter diagram of these data?

Model answer

An explanatory variable is the variable that is thought to explain or affect the other one. The manager thinks the depth of snow affects the number of lift passes sold, so the depth of snow is the explanatory variable, even though nobody controls it.
The depth of snow should go on the horizontal axis.

Explanation

In an experiment the explanatory (independent) variable is usually the one the experimenter changes, but in other investigations it is simply the variable thought to cause changes in the response (dependent) variable. The explanatory variable goes on the x-axis of a scatter diagram, whether or not it can be controlled.

Mark scheme
  1. 1 mark

    B1 for the explanatory variable is the one that is thought to affect the other variable (the depth of snow affects the number of passes sold, not the other way round); it does not have to be controlled

    oe. Accept 'the number of passes sold depends on the depth of snow, so the depth of snow is the explanatory variable'. B0 for 'the depth of snow is the explanatory variable' with no reason.

  2. 1 mark

    B1 for the depth of snow

    Accept 'snow depth' or 'the explanatory variable (snow depth)'. B0 for 'the number of lift passes' or 'time'. This mark is independent of the first mark.

Question 4

4 marks

Callum is investigating whether the pressure of the air in a bicycle's tyres affects how far the bicycle rolls.
He will let the bicycle roll, without pedalling, from the top of a slope, several times with the tyres pumped to different pressures. Each time he will measure the distance it rolls before it stops.

Write down the explanatory variable and the response variable in Callum's investigation.
Give one extraneous variable in this investigation, and describe how Callum could keep it the same.

Model answer

Explanatory variable: the tyre pressure.
Response variable: the distance the bicycle rolls.
Extraneous variable: the slope. Callum should use the same slope every time and release the bicycle from the same marked starting point, without pushing it.
Then any change in the distance rolled is due to the tyre pressure, not to a steeper or longer slope.

Explanation

The explanatory variable is the one Callum changes (tyre pressure) and the response variable is the one he measures (distance rolled). Extraneous variables, such as the slope, the starting point, the bicycle and the wind, could also affect the distance, so they must be kept the same in a practical way; otherwise a change in distance could not be put down to the tyre pressure.

Mark scheme
  1. 1 mark

    B1 for the explanatory variable is the tyre pressure

    Accept 'independent variable: tyre pressure'. B0 for 'the slope' or 'the bicycle'.

  2. 1 mark

    B1 for the response variable is the distance the bicycle rolls

    Accept 'dependent variable: distance rolled'. If the explanatory and response variables are given the wrong way round, award B0 for both. This mark is independent of the first mark.

  3. 1 mark

    B1 for a suitable extraneous variable, e.g. the slope used (its steepness or length) / the starting point / the bicycle used (or the mass on it) / the surface / the wind / the type of tyres

    oe. Any one variable, other than tyre pressure and distance, that could affect how far the bicycle rolls. B0 for 'the weather' alone with no link (accept 'the wind').

  4. 1 mark

    B1 for a practical way of keeping the variable given the same, e.g. use the same slope every time and release the bicycle from the same marked starting point / use the same bicycle with nothing added to it / do every roll on the same day when there is no wind

    oe. The method must match the extraneous variable given (if the extraneous variable mark was not awarded, award this mark for a practical way of keeping any valid extraneous variable the same). B0 for 'keep it the same' or 'make it a fair test' with no description of how.

Ready to try the rest? Every answer you write is marked against the mark scheme, so you can see exactly where the marks are.

Study Helper Hints first, answers after you try

Stuck on this one? Ask for a hint and I’ll point you in the right direction, without giving the answer away. Once you’ve checked your answer, I’ll show you how the marks are awarded.