Level:
Correct: 0
Incorrect: 0
Marks: 0/0
Exam Practice
Course:
Topics:
Edexcel GCSE Statistics (Higher Paper 2) Smart practice A mixed round aimed at your weak spots
Unit 1
The statistical enquiry cycle
Statistical enquiry cycle stages 1 and 2; (a) Planning: 1a.01, 1a.02, 1a.03
Statistical enquiry cycle: planning and collecting
Statistical enquiry cycle stages 3, 4 and 5
Statistical enquiry cycle: interpreting and evaluating
Unit 2
The collection of data
(b) Types of data: 1b.01, 1b.02, 1b.03
Types of data and variables
(b) Types of data: 1b.04; (d) Collecting data: 1d.01, 1d.02
Primary and secondary data, reliability and validity
(c) Population and sampling: 1c.01, 1c.02, 1c.03
Populations, sampling frames and non-random sampling
(c) Population and sampling: 1c.04, 1c.05
Random and systematic sampling
(c) Population and sampling: 1c.06
Stratified sampling
(d) Collecting data: 1d.05, 1d.06
Problems with collected data and cleaning data
Unit 3
Processing, representing and analysing data
(a) Tabulation, diagrams and representation: 2a.01
Tabulation, tallies, pictograms and two-way tables
(a) Tabulation, diagrams and representation: 2a.01, 2a.02
Pie charts and comparative pie charts
(a) Tabulation, diagrams and representation: 2a.01
Stem and leaf diagrams
(a) Tabulation, diagrams and representation: 2a.02
Population pyramids, choropleth maps and 2D and 3D diagrams
(a) Tabulation, diagrams and representation: 2a.04
Histograms and frequency density
(a) Tabulation, diagrams and representation: 2a.05, 2a.06, 2a.07, 2a.08
Choosing representations and misleading diagrams
(a) Tabulation, diagrams and representation: 2a.09, 2a.10
Skewness
(b) Measures of central tendency: 2b.01, 2b.02, 2b.03
Mode, median and mean
(b) Measures of central tendency: 2b.01
Weighted mean and geometric mean
(c) Measures of dispersion: 2c.01, 2c.06
Standard deviation and standardised scores
(a) Tabulation, diagrams and representation: 2a.03; (c) Measures of dispersion: 2c.02, 2c.03
Box plots and outliers
(b) Measures of central tendency: 2b.03; (c) Measures of dispersion: 2c.04, 2c.05
Comparing distributions
(d) Further summary statistics: 2d.01
Index numbers
(d) Further summary statistics: 2d.02
Rates of change
(e) Scatter diagrams and correlation: 2e.01, 2e.02, 2e.03
Scatter diagrams, correlation and causation
(e) Scatter diagrams and correlation: 2e.04
Lines of best fit and regression lines
(e) Scatter diagrams and correlation: 2e.05, 2e.06, 2e.07, 2e.08
Spearman's rank and product moment correlation coefficients
(f) Time series: 2f.01, 2f.02; (b) 2b.01 mean seasonal variation
Time series, moving averages and seasonal variation
(g) Quality assurance: 2g.01, 2g.02
Quality assurance and control charts
(h) Estimation: 2h.01, 2h.02, 2h.03
Estimation, sample size and capture-recapture
Unit 4
Probability
3. Probability: 3p.01, 3p.02, 3p.03, 3p.04
Probability, expected frequency and risk
3. Probability: 3p.05, 3p.06, 3p.10
Experimental and theoretical probability and bias
3. Probability: 3p.11
Binomial distribution
3. Probability: 3p.12, 3p.13
Normal distribution
Avg
score:
–
Topics
done:
0/40

Choosing representations and misleading diagrams

Practise 15 exam-style questions on Choosing representations and misleading diagrams for Edexcel GCSE Statistics (Higher Paper 2). Write your answer as you would in the exam and get it marked in seconds against the mark scheme, point by point, with the Study Helper on hand if you get stuck.

  • 15 questions
  • 1–5 marks each
  • Instant marking
  • No sign-up needed
15 questions, marked as you go

Sample questions with model answers

Here are 4 of the questions in this topic, each with a model answer, an explanation of why it earns the marks and the mark scheme an examiner would use.

Question 1

1 mark

A transport survey asked 60 commuters which bus route they use. The routes are numbered 1, 4, 7, 12, 23, 38 and 85.
Ruth typed the route numbers into a spreadsheet, and the software calculated that the mean route number is 23.7

Explain why this mean is not a useful statistic.

Model answer

The route numbers are labels that name the routes; they do not measure or count anything. Route 85 is not 'more' than route 7, so adding the numbers and dividing by 60 gives a number with no meaning. The software calculated it only because the labels were typed in as numbers.

Explanation

Software will calculate any statistic from whatever numbers it is given, so the user must decide whether the statistic makes sense for the type of data. Route numbers are qualitative (categorical) data that happen to be written as numbers. For data like these, the mode (the route used most) or a bar chart of the number of commuters using each route is appropriate.

Mark scheme
  1. 1 mark

    B1 for the route numbers are only labels (names) for the routes, not measurements or counts, so their mean has no meaning oe

    Accept 'the data are qualitative (categorical)', 'the numbers are just names, so adding them up means nothing' or 'if the routes were numbered differently the mean would change'. B0 for 'there is no route 23.7' or 'the mean is not a whole number' on their own (a mean of counts need not be a whole number either). B0 for 'the mean is affected by the extreme value 85' (that criticism is about genuine numerical data). Ignore a correct suggestion such as 'use the mode'.
Question 2

2 marks

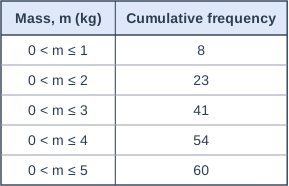
The table shows information about the masses, \(m\) kg, of the 60 parcels delivered to a village shop one week.

Ruby wants to show the same information as a frequency polygon.

Write down the coordinates of the points that her frequency polygon should have.

Table with columns "Mass, m (kg)", "Cumulative frequency". Mass, m (kg): 0 < m ≤ 1; Cumulative frequency: 8 | Mass, m (kg): 0 < m ≤ 2; Cumulative frequency: 23 | Mass, m (kg): 0 < m ≤ 3; Cumulative frequency: 41 | Mass, m (kg): 0 < m ≤ 4; Cumulative frequency: 54 | Mass, m (kg): 0 < m ≤ 5; Cumulative frequency: 60.

Model answer

Frequencies: \(8\), \(23 - 8 = 15\), \(41 - 23 = 18\), \(54 - 41 = 13\), \(60 - 54 = 6\)
Class midpoints: 0.5, 1.5, 2.5, 3.5, 4.5
Points: (0.5, 8), (1.5, 15), (2.5, 18), (3.5, 13), (4.5, 6)

Explanation

A cumulative frequency table gives running totals, so first find the frequency of each class by subtraction. A frequency polygon plots each frequency at its class midpoint, whereas a cumulative frequency graph plots each cumulative frequency at the upper class boundary; mixing these up is the most common error.

Mark scheme
  1. 1 mark

    M1 for the frequencies 8, 15, 18, 13, 6 (at least three correct)

    Found by subtracting consecutive cumulative frequencies. May be seen in a table or as the second coordinates of the points. Answer-only rule for this question: A correct answer with no working scores M1A1.

  2. 1 mark

    A1 for (0.5, 8), (1.5, 15), (2.5, 18), (3.5, 13), (4.5, 6)

    All five points needed, at the class midpoints. Points at the upper class boundaries, e.g. (1, 8), (2, 15), ..., score M1A0. Plotting the cumulative frequencies, e.g. (0.5, 8), (1.5, 23), ..., scores M0A0. Ignore any statement about joining the points. A correct answer with no working scores M1A1.

Question 3

3 marks

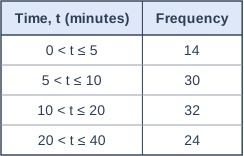
Lily recorded the times, \(t\) minutes, that 100 visitors queued for a ride at a theme park. The table shows her results.

Lily used the chart tool in a spreadsheet. It produced one bar for each class, with every bar the same width and the height of each bar equal to its frequency.
Lily says,
"My chart shows that the most common queuing times are between 10 and 20 minutes."

Work out the frequency density of each class.
Use your answers to explain why Lily's chart is misleading.

Table with columns "Time, t (minutes)", "Frequency". Time, t (minutes): 0 < t ≤ 5; Frequency: 14 | Time, t (minutes): 5 < t ≤ 10; Frequency: 30 | Time, t (minutes): 10 < t ≤ 20; Frequency: 32 | Time, t (minutes): 20 < t ≤ 40; Frequency: 24.

Model answer

Frequency densities (frequency \(\div\) class width):
\(0 < t \le 5\): \(14 \div 5 = 2.8\)
\(5 < t \le 10\): \(30 \div 5 = 6\)
\(10 < t \le 20\): \(32 \div 10 = 3.2\)
\(20 < t \le 40\): \(24 \div 20 = 1.2\)

The classes have different widths, so the frequencies should be shown by the areas of bars of different widths. The highest frequency density is 6, for \(5 < t \le 10\), so the queuing times are most concentrated between 5 and 10 minutes. The 10 to 20 minute class has the largest frequency only because it is twice as wide. Lily's chart also makes the 20 to 40 minute bar nearly as tall as the 5 to 10 minute bar, when the queuing times there are only a fifth as concentrated.

Explanation

Spreadsheet chart tools often treat classes as categories and draw bars of equal width, which only works when every class has the same width. With unequal classes, the height of each bar must be the frequency density, so that the area of each bar represents its frequency. Comparing the frequencies of classes of different widths exaggerates the wide classes.

Mark scheme
  1. 1 mark

    M1 for frequency divided by class width for at least two classes, e.g. \(14 \div 5\) or \(32 \div 10\)

    Using the class midpoint or the upper class boundary instead of the class width scores M0. Answer-only rule for this question: A correct answer with no working scores M1A1.

  2. 1 mark

    A1 for 2.8, 6, 3.2, 1.2

    All four needed, in order. Accept densities per 10 minutes (28, 60, 32, 12) if this unit is made clear. A correct answer with no working scores M1A1.

  3. 1 mark

    B1 for an explanation, e.g. the classes have different widths, so bars of equal width with height equal to frequency misrepresent the data: the highest frequency density is for \(5 < t \le 10\) (6), so the queuing times are most concentrated between 5 and 10 minutes, not between 10 and 20 minutes

    ft their frequency densities. Must refer to the frequency densities (or the different class widths) and say what the chart gets wrong, e.g. 'the 10 to 20 class has the most visitors only because it is twice as wide as the 5 to 10 class' or 'the 20 to 40 bar should be a fifth of the height of the 5 to 10 bar, but on Lily's chart it is nearly as tall'. 'It is not a histogram' alone scores B0. This mark is independent of the M1A1.

Question 4

4 marks

Two cafes, P and Q, opened on the same day.
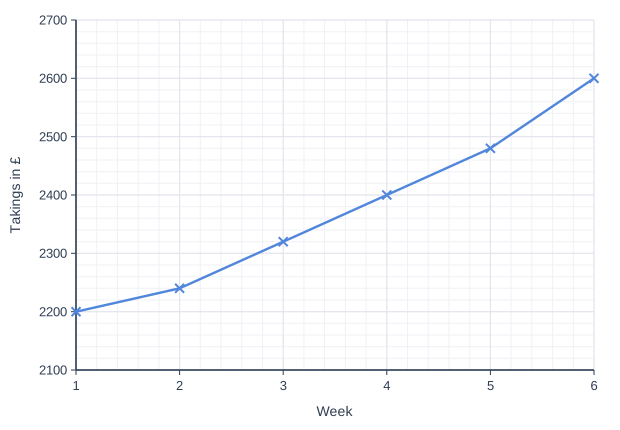
The line graph, produced by Cafe P's spreadsheet, shows Cafe P's takings in each of its first 6 weeks.
Cafe Q's takings were £1200 in week 1 and £1500 in week 6.

Ryan says,
"From week 1 to week 6, Cafe P's takings went up by a greater percentage than Cafe Q's takings, because Cafe P's graph rises so steeply."

Use the graph and the information about Cafe Q to assess Ryan's statement. You must show your working.
Give one reason why the steepness of Cafe P's graph is not a good guide to the percentage increase in its takings.

Line graph of takings in £ (y-axis, 2100 to 2700) against week (x-axis, 1 to 6). The line joins the points (1, 2200), (2, 2240), (3, 2320), (4, 2400), (5, 2480), (6, 2600).

Model answer

Cafe P (from the graph): £2200 in week 1 and £2600 in week 6.
Percentage increase \(= \dfrac{2600 - 2200}{2200} \times 100 = 18.2\%\)
Cafe Q: percentage increase \(= \dfrac{1500 - 1200}{1200} \times 100 = 25\%\)
18.2% < 25%, so Cafe Q's takings went up by the greater percentage. Ryan is wrong.

The steepness is not a good guide, because the vertical axis of Cafe P's graph starts at £2100, not at £0. The line starts only £100 above the bottom of the axis and ends £500 above it, so a rise of less than a fifth looks very steep. The steepness also shows the rise in pounds, not the rise as a percentage of the starting takings.

Explanation

When data are given in different formats, read off or work out the same statistic for each, here the percentage increase from week 1 to week 6. The steepness of a line depends on the scale: software often starts the vertical axis just below the smallest value, which stretches small changes, and a steep line shows a large rise in pounds, not necessarily a large percentage rise. Read the values from the scale instead of judging the line.

Mark scheme
  1. 1 mark

    M1 for \(\dfrac{2600 - 2200}{2200} \times 100\) (= 18.2%) oe for Cafe P

    Values read from the graph: £2200 in week 1 and £2600 in week 6. Accept \(\dfrac{2600}{2200}\) (= 1.18...). Dividing by 2600 scores M0.

  2. 1 mark

    M1 for \(\dfrac{1500 - 1200}{1200} \times 100\) (= 25%) oe for Cafe Q

    Accept \(\dfrac{1500}{1200}\) (= 1.25). Dividing by 1500 scores M0.

  3. 1 mark

    A1 for Ryan is wrong, because Cafe P's percentage increase (18.2%) is less than Cafe Q's (25%)

    Dependent on both M marks. Accept 18% or 18.18...%. Both percentages (or multipliers) must be compared. 'Cafe P's takings rose by more money (£400 > £300)' is not a comparison of percentages and does not earn this mark. Answer only (a decision or values with no working) scores 0, as the question asks for working.

  4. 1 mark

    B1 for one correct reason, e.g. the vertical axis starts at £2100, not at £0 (it is truncated), so a small rise looks steep / the steepness depends on the scale chosen for the vertical axis / the steepness shows the rise in pounds, not the rise as a percentage of the week 1 takings oe

    The reason must say why the steepness misleads. Accept 'the line rises from £100 to £500 above the bottom of the axis, which looks like a five-fold increase'. B0 for 'the scale is misleading' or 'the graph is wrong' with no further explanation, and B0 for 'there is no graph for Cafe Q' alone. Ignore comments about the horizontal axis. This mark is independent of the first three marks.

Ready to try the rest? Every answer you write is marked against the mark scheme, so you can see exactly where the marks are.

Study Helper Hints first, answers after you try

Stuck on this one? Ask for a hint and I’ll point you in the right direction, without giving the answer away. Once you’ve checked your answer, I’ll show you how the marks are awarded.