
Level:
Correct: 0
Incorrect: 0
Marks: 0/0
Exam Practice
Course:
Topics:
Edexcel GCSE Statistics (Higher Paper 2) Smart practice A mixed round aimed at your weak spots
Unit 1
The statistical enquiry cycle
Statistical enquiry cycle stages 1 and 2; (a) Planning: 1a.01, 1a.02, 1a.03
Statistical enquiry cycle: planning and collecting
Statistical enquiry cycle stages 3, 4 and 5
Statistical enquiry cycle: interpreting and evaluating
Unit 2
The collection of data
(b) Types of data: 1b.01, 1b.02, 1b.03
Types of data and variables
(b) Types of data: 1b.04; (d) Collecting data: 1d.01, 1d.02
Primary and secondary data, reliability and validity
(c) Population and sampling: 1c.01, 1c.02, 1c.03
Populations, sampling frames and non-random sampling
(c) Population and sampling: 1c.04, 1c.05
Random and systematic sampling
(c) Population and sampling: 1c.06
Stratified sampling
(d) Collecting data: 1d.05, 1d.06
Problems with collected data and cleaning data
Unit 3
Processing, representing and analysing data
(a) Tabulation, diagrams and representation: 2a.01
Tabulation, tallies, pictograms and two-way tables
(a) Tabulation, diagrams and representation: 2a.01, 2a.02
Pie charts and comparative pie charts
(a) Tabulation, diagrams and representation: 2a.01
Stem and leaf diagrams
(a) Tabulation, diagrams and representation: 2a.02
Population pyramids, choropleth maps and 2D and 3D diagrams
(a) Tabulation, diagrams and representation: 2a.04
Histograms and frequency density
(a) Tabulation, diagrams and representation: 2a.05, 2a.06, 2a.07, 2a.08
Choosing representations and misleading diagrams
(a) Tabulation, diagrams and representation: 2a.09, 2a.10
Skewness
(b) Measures of central tendency: 2b.01, 2b.02, 2b.03
Mode, median and mean
(b) Measures of central tendency: 2b.01
Weighted mean and geometric mean
(c) Measures of dispersion: 2c.01, 2c.06
Standard deviation and standardised scores
(a) Tabulation, diagrams and representation: 2a.03; (c) Measures of dispersion: 2c.02, 2c.03
Box plots and outliers
(b) Measures of central tendency: 2b.03; (c) Measures of dispersion: 2c.04, 2c.05
Comparing distributions
(d) Further summary statistics: 2d.01
Index numbers
(d) Further summary statistics: 2d.02
Rates of change
(e) Scatter diagrams and correlation: 2e.01, 2e.02, 2e.03
Scatter diagrams, correlation and causation
(e) Scatter diagrams and correlation: 2e.04
Lines of best fit and regression lines
(e) Scatter diagrams and correlation: 2e.05, 2e.06, 2e.07, 2e.08
Spearman's rank and product moment correlation coefficients
(f) Time series: 2f.01, 2f.02; (b) 2b.01 mean seasonal variation
Time series, moving averages and seasonal variation
(g) Quality assurance: 2g.01, 2g.02
Quality assurance and control charts
(h) Estimation: 2h.01, 2h.02, 2h.03
Estimation, sample size and capture-recapture
Unit 4
Probability
3. Probability: 3p.01, 3p.02, 3p.03, 3p.04
Probability, expected frequency and risk
3. Probability: 3p.05, 3p.06, 3p.10
Experimental and theoretical probability and bias
3. Probability: 3p.11
Binomial distribution
3. Probability: 3p.12, 3p.13
Normal distribution
Avg
score:
–
Topics
done:
0/40

Stratified sampling

Practise 13 exam-style questions on Stratified sampling for Edexcel GCSE Statistics (Higher Paper 2). Write your answer as you would in the exam and get it marked in seconds against the mark scheme, point by point, with the Study Helper on hand if you get stuck.

  • 13 questions
  • 1–5 marks each
  • Instant marking
  • No sign-up needed
13 questions, marked as you go

Sample questions with model answers

Here are 4 of the questions in this topic, each with a model answer, an explanation of why it earns the marks and the mark scheme an examiner would use.

Question 1

1 mark

A car hire company wants to estimate the mean distance driven on the 12 000 hires it had last year. For each hire, its records show the customer's age and gender, the number of days the vehicle was hired for, and the type of vehicle (small car, family car or van).

The company will take a sample of the hires, stratified by one variable other than age or gender.

Suggest which variable it should use, and give a reason.

Model answer

The number of days of the hire (in groups, such as 1 day, 2 to 6 days and 7 days or more). A vehicle hired for two weeks is likely to be driven much further than one hired for a day, so stratifying by the length of the hire makes sure that short and long hires are each represented in proportion to how common they are.

Explanation

A good stratification variable is one that is likely to affect what is being measured, and one that is known for every member of the population before sampling. Here the population is the 12 000 hires, not people; the length of each hire is in the records and is likely to have a big effect on the distance driven, so stratifying by it stops short or long hires being over- or under-represented by chance.

Mark scheme
  1. 1 mark

    B1 for the number of days of the hire (length of hire, in groups such as 1 day, 2 to 6 days, 7 days or more), with a reason, eg vehicles hired for longer are likely to be driven much further, so short and long hires must each be represented in proportion

    oe. Accept type of vehicle with a reason linked to the distance driven, eg vans are often hired for short local moves, while family cars may be hired for long holiday journeys. The variable and a reason linked to the distance driven are both needed. Do not accept a variable that is not in the records (eg the purpose of the hire or the customer's home town), or a reason such as 'to make it fair' or 'to make it representative' with no link to the distance driven.
Question 2

2 marks

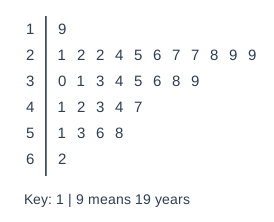
The stem and leaf diagram shows the ages, in years, of the 30 staff at a call centre.

The manager wants a sample of 10 of the staff, stratified by age group: under 30, 30 to 44, and 45 and over.

Work out the number of staff from each age group that should be in the sample.

Stem and leaf diagram. Key: 1 | 9 means 19 years. Rows (stem | leaves): 1 | 9; 2 | 1 2 2 4 5 6 7 7 8 9 9; 3 | 0 1 3 4 5 6 8 9; 4 | 1 2 3 4 7; 5 | 1 3 6 8; 6 | 2.

Model answer

Under 30: 12 staff; 30 to 44: 12 staff; 45 and over: 6 staff (total 30)
Under 30: \(\dfrac{12}{30} \times 10 = 4\)
30 to 44: \(\dfrac{12}{30} \times 10 = 4\)
45 and over: \(\dfrac{6}{30} \times 10 = 2\)

Explanation

First count how many staff are in each age group, taking care with the boundary values such as 29, 30 and 44. Each group's share of the sample is its fraction of the 30 staff multiplied by the sample size; here the sampling fraction is 1 in 3. Check that the numbers add up to 10.

Mark scheme
  1. 1 mark

    M1 for the number of staff in at least two of the age groups (12 under 30, 12 aged 30 to 44, 6 aged 45 and over) or a correct method for one age group, eg \(\dfrac{12}{30} \times 10\)

    Counting errors at the boundaries are common: 29 is under 30, and 44 is in the group 30 to 44. Answer-only rule for this question: Correct answers with no working score M1A1.

  2. 1 mark

    A1 for 4 (under 30), 4 (30 to 44) and 2 (45 and over)

    cao. All three are needed. Correct answers with no working score M1A1.

Question 3

3 marks

A golf club has 480 members. \(\dfrac{5}{12}\) of the members are women. 30% of the men and 40% of the women are aged 60 or over.

The club takes a sample of 48 members, stratified by both gender and age group (under 60, and 60 or over).

Work out the number of women aged under 60 in the sample.

Model answer

Women: \(\dfrac{5}{12} \times 480 = 200\)
Women aged under 60: \(100\% - 40\% = 60\%\), so \(0.6 \times 200 = 120\)
Sample: \(\dfrac{120}{480} \times 48 = 12\) women aged under 60

Explanation

Stratifying by two variables makes four strata: men under 60, men aged 60 or over, women under 60 and women aged 60 or over. Work out the size of the stratum you need first (here 120 women under 60), then multiply its fraction of the population by the sample size. The common error is to use the 40% of women who are 60 or over instead of the 60% who are under 60.

Mark scheme
  1. 1 mark

    M1 for \(\dfrac{5}{12} \times 480\) (= 200) or \(\dfrac{5}{12} \times 48\) (= 20) oe

    Implied by 200 women in the club or 20 women in the sample. Answer-only rule for this question: A correct answer with no working scores M1M1A1.

  2. 1 mark

    M1 for \(0.6 \times\) their 200 (= 120) or \(0.6 \times\) their 20 oe

    Using 0.4 (the women aged 60 or over), giving 80 or 8, scores M0 for this mark.

  3. 1 mark

    A1 for 12

    cao. A correct answer with no working scores M1M1A1. Alternative method: \(\dfrac{5}{12} \times 0.6 \times 48 = 12\).

Question 4

4 marks

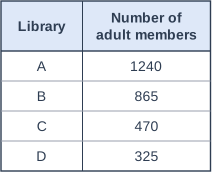
A county has four libraries. The table shows the number of adult members of each library.

Ruth wants to choose a sample of 50 of these members, stratified by library.

Describe how Ruth should choose her sample. Your description should include the number she needs from each library, with your working.

Table with columns "Library", "Number of adult members". Library: A; Number of adult members: 1240 | Library: B; Number of adult members: 865 | Library: C; Number of adult members: 470 | Library: D; Number of adult members: 325.

Model answer

Total = 1240 + 865 + 470 + 325 = 2900 members
Library A: \(\dfrac{1240}{2900} \times 50 = 21.37...\), so 21
Library B: \(\dfrac{865}{2900} \times 50 = 14.91...\), so 15
Library C: \(\dfrac{470}{2900} \times 50 = 8.10...\), so 8
Library D: \(\dfrac{325}{2900} \times 50 = 5.60...\), so 6
Check: 21 + 15 + 8 + 6 = 50
For each library, number the members on its list of adult members. Use a calculator to generate random numbers in that range, ignoring repeats, until she has the number she needs from that library: 21 from library A, 15 from library B, 8 from library C and 6 from library D.

Explanation

A stratified sample needs two things: the right number from each stratum, and random selection within each stratum. The number from each library is its fraction of all 2900 members times 50, rounded to a whole number, and the rounded values must add up to 50. Then each library's members are sampled separately, using random numbers on that library's list.

Mark scheme
  1. 1 mark

    B1 for a correct method for the number from each library: (number of members of that library \(\div\) 2900) \(\times\) 50 oe

    May be seen in a correct calculation for one library, eg \(\dfrac{1240}{2900} \times 50\) (= 21.37...). The total of 2900 must be used. Answer-only rule for this question: Correct values with no working score the first three marks.

  2. 1 mark

    B1 for one correct whole number (A 21, B 15, C 8 or D 6)

    For this mark, accept either whole number next to the unrounded value (eg A 21 or 22). Ignore subsequent incorrect values for this mark.

  3. 1 mark

    B1 for all four correct: A 21, B 15, C 8, D 6

    These are the values rounded to the nearest whole number (21.37..., 14.91..., 8.10..., 5.60...), and they add up to 50 (rounding down every value and then rounding up the two with the largest remainders gives the same four values). Other sets of whole numbers score B0 for this mark, even if they add up to 50; truncating every value gives a total of only 48, and rounding every value up gives 52. Correct values with no working score the first three marks.

  4. 1 mark

    B1 for choosing the members at random within each library, eg number the members on each library's list and use random numbers (from a calculator or computer) to choose the number needed, ignoring repeats

    oe. Each library must be sampled separately and the method must be random. Do not accept 'choose them at random' with no method, or 'ask the first 21 members who visit library A'.

Ready to try the rest? Every answer you write is marked against the mark scheme, so you can see exactly where the marks are.

Study Helper Hints first, answers after you try

Stuck on this one? Ask for a hint and I’ll point you in the right direction, without giving the answer away. Once you’ve checked your answer, I’ll show you how the marks are awarded.