Level:
Correct: 0
Incorrect: 0
Marks: 0/0
Exam Practice
Course:
Topics:
Edexcel GCSE Statistics (Higher Paper 2) Smart practice A mixed round aimed at your weak spots
Unit 1
The statistical enquiry cycle
Statistical enquiry cycle stages 1 and 2; (a) Planning: 1a.01, 1a.02, 1a.03
Statistical enquiry cycle: planning and collecting
Statistical enquiry cycle stages 3, 4 and 5
Statistical enquiry cycle: interpreting and evaluating
Unit 2
The collection of data
(b) Types of data: 1b.01, 1b.02, 1b.03
Types of data and variables
(b) Types of data: 1b.04; (d) Collecting data: 1d.01, 1d.02
Primary and secondary data, reliability and validity
(c) Population and sampling: 1c.01, 1c.02, 1c.03
Populations, sampling frames and non-random sampling
(c) Population and sampling: 1c.04, 1c.05
Random and systematic sampling
(c) Population and sampling: 1c.06
Stratified sampling
(d) Collecting data: 1d.05, 1d.06
Problems with collected data and cleaning data
Unit 3
Processing, representing and analysing data
(a) Tabulation, diagrams and representation: 2a.01
Tabulation, tallies, pictograms and two-way tables
(a) Tabulation, diagrams and representation: 2a.01, 2a.02
Pie charts and comparative pie charts
(a) Tabulation, diagrams and representation: 2a.01
Stem and leaf diagrams
(a) Tabulation, diagrams and representation: 2a.02
Population pyramids, choropleth maps and 2D and 3D diagrams
(a) Tabulation, diagrams and representation: 2a.04
Histograms and frequency density
(a) Tabulation, diagrams and representation: 2a.05, 2a.06, 2a.07, 2a.08
Choosing representations and misleading diagrams
(a) Tabulation, diagrams and representation: 2a.09, 2a.10
Skewness
(b) Measures of central tendency: 2b.01, 2b.02, 2b.03
Mode, median and mean
(b) Measures of central tendency: 2b.01
Weighted mean and geometric mean
(c) Measures of dispersion: 2c.01, 2c.06
Standard deviation and standardised scores
(a) Tabulation, diagrams and representation: 2a.03; (c) Measures of dispersion: 2c.02, 2c.03
Box plots and outliers
(b) Measures of central tendency: 2b.03; (c) Measures of dispersion: 2c.04, 2c.05
Comparing distributions
(d) Further summary statistics: 2d.01
Index numbers
(d) Further summary statistics: 2d.02
Rates of change
(e) Scatter diagrams and correlation: 2e.01, 2e.02, 2e.03
Scatter diagrams, correlation and causation
(e) Scatter diagrams and correlation: 2e.04
Lines of best fit and regression lines
(e) Scatter diagrams and correlation: 2e.05, 2e.06, 2e.07, 2e.08
Spearman's rank and product moment correlation coefficients
(f) Time series: 2f.01, 2f.02; (b) 2b.01 mean seasonal variation
Time series, moving averages and seasonal variation
(g) Quality assurance: 2g.01, 2g.02
Quality assurance and control charts
(h) Estimation: 2h.01, 2h.02, 2h.03
Estimation, sample size and capture-recapture
Unit 4
Probability
3. Probability: 3p.01, 3p.02, 3p.03, 3p.04
Probability, expected frequency and risk
3. Probability: 3p.05, 3p.06, 3p.10
Experimental and theoretical probability and bias
3. Probability: 3p.11
Binomial distribution
3. Probability: 3p.12, 3p.13
Normal distribution
Avg
score:
–
Topics
done:
0/40

Comparing distributions

Practise 17 exam-style questions on Comparing distributions for Edexcel GCSE Statistics (Higher Paper 2). Write your answer as you would in the exam and get it marked in seconds against the mark scheme, point by point, with the Study Helper on hand if you get stuck.

  • 17 questions
  • 1–5 marks each
  • Instant marking
  • No sign-up needed
17 questions, marked as you go

Sample questions with model answers

Here are 4 of the questions in this topic, each with a model answer, an explanation of why it earns the marks and the mark scheme an examiner would use.

Question 1

1 mark

A hospital compared the waiting times for appointments at two of its clinics. At one clinic, a patient waited 94 days because his appointment was cancelled twice. All the other waiting times at the two clinics were between 3 and 41 days.

Give one reason why the interdecile range is better than the range for comparing the spread of the waiting times at the two clinics.

Model answer

The range uses only the shortest and the longest waits, so the one wait of 94 days would make the range for that clinic much bigger. The interdecile range (90th percentile - 10th percentile) covers the middle 80% of the waiting times, so it is not affected by this extreme value.

Explanation

Measures of spread based on percentiles or quartiles, such as the interdecile and interquartile ranges, leave out the extreme ends of the data, so an outlier does not distort them. The range depends only on the two most extreme values, so one unusual wait can make a comparison of ranges misleading.

Mark scheme
  1. 1 mark

    B1 for the interdecile range is not affected by extreme values such as the wait of 94 days (it uses only the middle 80% of the data), but the range is

    oe, e.g. 'the range uses only the shortest and longest waits, so the one wait of 94 days makes that clinic's range much bigger'. Accept 'outlier' for extreme value. B0 for 'it is more accurate', 'it is more reliable' or 'it uses more of the data' with no reference to extreme values or outliers.

Question 2

2 marks

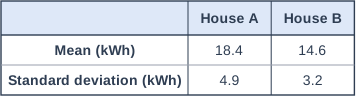
Two houses on the same street have solar panels. The panels on House A face south and the panels on House B face west. The table shows information about the electricity generated each day in June by the panels on the two houses.

Compare the electricity generated each day by the panels on the two houses.

Table with columns (row headings), "House A", "House B". Mean (kWh); House A: 18.4; House B: 14.6 | Standard deviation (kWh); House A: 4.9; House B: 3.2.

Model answer

The mean for House A (18.4 kWh) is greater than the mean for House B (14.6 kWh), so House A's panels generated more electricity per day on average.
The standard deviation for House B (3.2 kWh) is smaller than for House A (4.9 kWh), so the amount generated by House B's panels was more consistent from day to day.

Explanation

With a mean and a standard deviation for each data set, compare the means and the standard deviations and say what each comparison means for the electricity generated. A smaller standard deviation means more consistent, not less electricity.

Mark scheme
  1. 1 mark

    B1 for a correct comparison of the means in context, e.g. House A's panels generated more electricity per day on average (18.4 > 14.6)

    Accept 'average' for mean. B0 for 'the mean is 18.4 whereas the mean is 14.6' with no comparison.

  2. 1 mark

    B1 for a correct comparison of the standard deviations in context, e.g. the amount of electricity generated by House B's panels was more consistent from day to day (3.2 < 4.9)

    B0 if linked to the amount generated, e.g. 'House A has the larger standard deviation, so it generated more'. If both comparisons are correct but neither is in context, award B1 only. Ignore values unless they are wrong.

Question 3

3 marks

A council changed the timing of the traffic lights in a town centre. It timed 50 bus journeys through the town centre before the change and 50 bus journeys after the change. The table shows information about the journey times.

The council says, "Since the change, bus journeys through the town centre are quicker and more reliable."

Do the statistics support the council's statement? You must give reasons for your answer.

Table with columns (row headings), "Before the change", "After the change". Mean journey time (minutes); Before the change: 18.6; After the change: 17.2 | Standard deviation (minutes); Before the change: 4.1; After the change: 5.3.

Model answer

Mean: 17.2 < 18.6, so after the change the journeys were quicker on average. This part is supported.
Standard deviation: 5.3 > 4.1, so after the change the journey times varied more, so they were less reliable. This part is not supported.
The statistics support 'quicker' but not 'more reliable'.

Explanation

Assess each part of a statement separately. 'Quicker' is about the average and 'more reliable' is about the spread: a larger standard deviation means that the times vary more, so they are less reliable. Each part needs its own decision.

Mark scheme
  1. 1 mark

    B1 for a correct comparison of the means, e.g. the mean after the change is lower (17.2 < 18.6), so the journeys are quicker on average

    Accept 'average' for mean if both means are quoted and compared. B0 for stating the two values with no comparison.

  2. 1 mark

    B1 for a correct comparison of the standard deviations, e.g. the standard deviation after the change is higher (5.3 > 4.1), so the journey times are less consistent (less reliable)

    B0 if the standard deviation is linked to the journeys being quicker or slower.

  3. 1 mark

    B1 for a correct decision on both parts: the statistics support 'quicker' but do not support 'more reliable'

    Dependent on both B1 marks above (the question asks for reasons). B0 for 'yes' or 'no' overall with no distinction between the two parts.

Question 4

4 marks

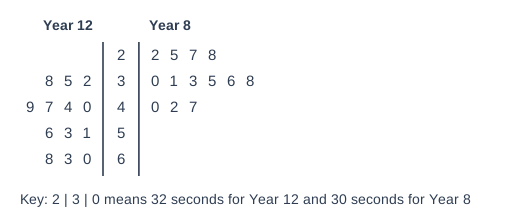
A PE teacher timed how long, in seconds, 13 Year 12 students and 13 Year 8 students could balance on one leg with their eyes closed. The back-to-back stem-and-leaf diagram shows the times.

The teacher makes two conclusions.

1. The Year 12 students balanced for longer than the Year 8 students.
2. The times of the Year 12 students are more consistent than the times of the Year 8 students.

By working out the median and the interquartile range for each year group, assess the teacher's two conclusions. You should show clearly the values of any statistics you use.

Back-to-back stem and leaf diagram. Key: 2 | 3 | 0 means 32 seconds for Year 12 and 30 seconds for Year 8. The stems are in the middle column; "Year 12" leaves are on the left, read outwards from the stem (smallest next to the stem), and "Year 8" leaves are on the right. Rows (Year 12 leaves | stem | Year 8 leaves): none | 2 | 2 5 7 8; 2 5 8 | 3 | 0 1 3 5 6 8; 0 4 7 9 | 4 | 0 2 7; 1 3 6 | 5 | none; 0 3 8 | 6 | none.

Model answer

Year 12, in order: 32 35 38 40 44 47 49 51 53 56 60 63 68
Median = 7th value = 49
Lower quartile = 3.5th value = 39, upper quartile = 10.5th value = 58, IQR = 58 - 39 = 19
Year 8, in order: 22 25 27 28 30 31 33 35 36 38 40 42 47
Median = 33, lower quartile = 27.5, upper quartile = 39, IQR = 39 - 27.5 = 11.5
Conclusion 1: 49 > 33, so the Year 12 students balanced for longer on average. Conclusion 1 is supported.
Conclusion 2: 19 > 11.5, so the Year 12 times are less consistent. Conclusion 2 is not supported.

Explanation

Read the left-hand leaves outwards from the stem. With 13 values the median is the 7th, and the quartiles are at the 3.5th and 10.5th values (other quartile methods give slightly different values but the same conclusions). Each conclusion needs a comparison of the values and a clear decision; a common error is to treat a larger IQR as more consistent.

Mark scheme
  1. 1 mark

    B1 for medians 49 (Year 12) and 33 (Year 8)

    The 7th value of each year group. Both needed.

  2. 1 mark

    B1 for interquartile ranges 19 (Year 12) and 11.5 (Year 8)

    Accept only these pairs, each from one method used for both year groups: 19 and 11.5 (quartiles 39 and 58, and 27.5 and 39: the (n + 1) positions, or the medians of the halves without the median); 16.75 and 10.25 (quartiles 38.5 and 55.25, and 27.25 and 37.5: the n/4 and 3n/4 positions, interpolated); 16 and 10 (quartiles 40 and 56, and 28 and 38: the 4th and 10th values, or the medians of the halves including the median). This list overrides the general note in the figure description that any value between the two neighbouring values is usually accepted: other quartiles (e.g. 38 and 60 for Year 12) are B0 for this mark. Both needed. Ranges (36 and 25) are not interquartile ranges: B0 for this mark.

  3. 1 mark

    B1ft for conclusion 1 is supported, because 49 > 33 (the Year 12 median is higher)

    ft their medians. The comparison must be stated in symbols or words, and a clear decision is needed. 'The medians are 49 and 33' or 'whereas' alone is B0.

  4. 1 mark

    B1ft for conclusion 2 is not supported, because 19 > 11.5 (the Year 12 IQR is greater, so their times are less consistent)

    ft their interquartile ranges. The comparison and the decision are both needed. A decision based only on the ranges scores B0 here (the question asks for the IQR). B0 if the IQR is linked to balancing for longer or shorter.

Ready to try the rest? Every answer you write is marked against the mark scheme, so you can see exactly where the marks are.

Study Helper Hints first, answers after you try

Stuck on this one? Ask for a hint and I’ll point you in the right direction, without giving the answer away. Once you’ve checked your answer, I’ll show you how the marks are awarded.