
Level:
Correct: 0
Incorrect: 0
Marks: 0/0
Exam Practice
Course:
Topics:
Edexcel GCSE Statistics (Higher Paper 2) Smart practice A mixed round aimed at your weak spots
Unit 1
The statistical enquiry cycle
Statistical enquiry cycle stages 1 and 2; (a) Planning: 1a.01, 1a.02, 1a.03
Statistical enquiry cycle: planning and collecting
Statistical enquiry cycle stages 3, 4 and 5
Statistical enquiry cycle: interpreting and evaluating
Unit 2
The collection of data
(b) Types of data: 1b.01, 1b.02, 1b.03
Types of data and variables
(b) Types of data: 1b.04; (d) Collecting data: 1d.01, 1d.02
Primary and secondary data, reliability and validity
(c) Population and sampling: 1c.01, 1c.02, 1c.03
Populations, sampling frames and non-random sampling
(c) Population and sampling: 1c.04, 1c.05
Random and systematic sampling
(c) Population and sampling: 1c.06
Stratified sampling
(d) Collecting data: 1d.05, 1d.06
Problems with collected data and cleaning data
Unit 3
Processing, representing and analysing data
(a) Tabulation, diagrams and representation: 2a.01
Tabulation, tallies, pictograms and two-way tables
(a) Tabulation, diagrams and representation: 2a.01, 2a.02
Pie charts and comparative pie charts
(a) Tabulation, diagrams and representation: 2a.01
Stem and leaf diagrams
(a) Tabulation, diagrams and representation: 2a.02
Population pyramids, choropleth maps and 2D and 3D diagrams
(a) Tabulation, diagrams and representation: 2a.04
Histograms and frequency density
(a) Tabulation, diagrams and representation: 2a.05, 2a.06, 2a.07, 2a.08
Choosing representations and misleading diagrams
(a) Tabulation, diagrams and representation: 2a.09, 2a.10
Skewness
(b) Measures of central tendency: 2b.01, 2b.02, 2b.03
Mode, median and mean
(b) Measures of central tendency: 2b.01
Weighted mean and geometric mean
(c) Measures of dispersion: 2c.01, 2c.06
Standard deviation and standardised scores
(a) Tabulation, diagrams and representation: 2a.03; (c) Measures of dispersion: 2c.02, 2c.03
Box plots and outliers
(b) Measures of central tendency: 2b.03; (c) Measures of dispersion: 2c.04, 2c.05
Comparing distributions
(d) Further summary statistics: 2d.01
Index numbers
(d) Further summary statistics: 2d.02
Rates of change
(e) Scatter diagrams and correlation: 2e.01, 2e.02, 2e.03
Scatter diagrams, correlation and causation
(e) Scatter diagrams and correlation: 2e.04
Lines of best fit and regression lines
(e) Scatter diagrams and correlation: 2e.05, 2e.06, 2e.07, 2e.08
Spearman's rank and product moment correlation coefficients
(f) Time series: 2f.01, 2f.02; (b) 2b.01 mean seasonal variation
Time series, moving averages and seasonal variation
(g) Quality assurance: 2g.01, 2g.02
Quality assurance and control charts
(h) Estimation: 2h.01, 2h.02, 2h.03
Estimation, sample size and capture-recapture
Unit 4
Probability
3. Probability: 3p.01, 3p.02, 3p.03, 3p.04
Probability, expected frequency and risk
3. Probability: 3p.05, 3p.06, 3p.10
Experimental and theoretical probability and bias
3. Probability: 3p.11
Binomial distribution
3. Probability: 3p.12, 3p.13
Normal distribution
Avg
score:
–
Topics
done:
0/40

Index numbers

Practise 16 exam-style questions on Index numbers for Edexcel GCSE Statistics (Higher Paper 2). Write your answer as you would in the exam and get it marked in seconds against the mark scheme, point by point, with the Study Helper on hand if you get stuck.

  • 16 questions
  • 1–5 marks each
  • Instant marking
  • No sign-up needed
16 questions, marked as you go

Sample questions with model answers

Here are 4 of the questions in this topic, each with a model answer, an explanation of why it earns the marks and the mark scheme an examiner would use.

Question 1

1 mark

A country's statistics office publishes the consumer price index (CPI) each year, using 2015 as the base year.

A newspaper changes these values into chain base index numbers, so that each year is compared with the year before.

Give one advantage of the chain base index numbers for the newspaper's readers.

Model answer

Each chain base index number compares prices with prices one year earlier, so it shows the percentage change in prices in each year directly: the yearly rate of inflation.

For example, a chain base index number of 104 means that, on average, prices rose by 4% that year, so readers can see straight away how fast prices rose each year.

Explanation

A chain base index number uses the year before as its base, so the index number minus 100 is that year's percentage change. The CPI with 2015 as the base year shows the total change in prices since 2015 instead, and the change in each year has to be worked out from it. Saying only that chain base index numbers are 'more accurate' or 'more up to date' does not explain an advantage.

Mark scheme
  1. 1 mark

    B1 for each chain base index number shows the percentage change in prices from the year before (the yearly rate of inflation), so readers can see directly how much prices rose each year (eg 104 means prices rose by 4% that year) oe

    Also accept 'it is easy to see whether prices are rising faster or more slowly than the year before' or 'each year is compared with the year before, not with 2015, which may be a long time ago'. B0 for 'they are more accurate', 'they are easier to work out', 'they are more up to date' or 'they show the trend' with no further explanation. B0 for 'they show how much prices have changed since 2015' (that is what the CPI with 2015 as the base year shows). Ignore extraneous non-contradictory comments.
Question 2

2 marks

The price of one model of electric bike fell by £36 from 2024 to 2025

The chain base index number for the price of this electric bike in 2025 is 96.0

Work out the price of the electric bike in 2025

Model answer

A chain base index number of 96.0 means the 2025 price was 96% of the 2024 price, so the price fell by 4% of the 2024 price.

4% of the 2024 price = £36
2024 price \(= 36 \div 0.04 = \)£900
2025 price \(= 900 - 36 = \)£864

£864

Explanation

A chain base index number compares each year with the year before, so 96.0 means a 4% fall from 2024 to 2025. The £36 fall is 4% of the 2024 price, which gives the 2024 price (£900) and then the 2025 price. Dividing 36 by 0.96 is the common mistake.

Mark scheme
  1. 1 mark

    M1 for \(36 \div 0.04\) (= 900) oe, eg \(\dfrac{36}{4} \times 100\), or \(\dfrac{36}{4} \times 96\)

    For recognising that the fall of £36 is 4% of the 2024 price, eg \(0.04p = 36\) or \(p - 0.96p = 36\). Accept 900 seen as the 2024 price. \(36 \div 0.96\) (= 37.5) or \(36 \times 0.96\) scores M0. Answer-only rule for this question: A correct answer with no working scores both marks.

  2. 1 mark

    A1 for (£)864

    cao. A correct answer with no working scores both marks. An answer of 900 (the 2024 price) scores M1A0.

Question 3

3 marks

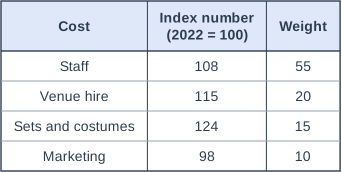
A theatre company works out a weighted index number for its costs in 2025, using 2022 as the base year.

The table shows the index numbers and the weights for its four costs. The weighted index number for the company's costs in 2025 is 110.8

The director says,
"Sets and costumes caused more of the increase in our costs than any other cost, because their index number went up the most."

Is the director correct?
You must show your working.

Table with columns "Cost", "Index number (2022 = 100)", "Weight". Cost: Staff; Index number (2022 = 100): 108; Weight: 55 | Cost: Venue hire; Index number (2022 = 100): 115; Weight: 20 | Cost: Sets and costumes; Index number (2022 = 100): 124; Weight: 15 | Cost: Marketing; Index number (2022 = 100): 98; Weight: 10.

Model answer

Each cost adds weight \(\times\) (index number - 100) to the total, which is then divided by 100 (the sum of the weights).

Staff: \(55 \times 8 = 440\)
Venue hire: \(20 \times 15 = 300\)
Sets and costumes: \(15 \times 24 = 360\)
Marketing: \(10 \times -2 = -20\)

Check: \((440 + 300 + 360 - 20) \div 100 = 10.8\), the rise from 100 to 110.8

Staff costs added 4.4 points to the index but sets and costumes only 3.6 points.

The director is not correct. The price of sets and costumes rose by the largest percentage, but staff has by far the largest weight, so staff costs caused the largest part of the increase.

Explanation

In a weighted index, the effect of each cost depends both on how much its index number rose and on the size of its weight. Multiplying each weight by the rise in its index number shows how much each cost contributed; these contributions add up to the rise in the weighted index (after dividing by the sum of the weights). Looking only at the index numbers, as the director did, ignores the weights.

Mark scheme
  1. 1 mark

    M1 for a method that allows for the weights, eg weight \(\times\) (index number - 100) for at least two costs: staff \(55 \times 8\) (= 440), venue hire \(20 \times 15\) (= 300), sets and costumes \(15 \times 24\) (= 360), marketing \(10 \times -2\) (= -20)

    Also accept index number \(\times\) weight compared with 100 \(\times\) weight (eg staff 5940 - 5500), or each cost's share of the rise of 10.8 points (staff 4.4, venue hire 3.0, sets and costumes 3.6, marketing -0.2), or treating the weights as amounts spent in 2022 (eg staff costs rose by 8% of 55).

  2. 1 mark

    A1 for 440 (or 4.4) for staff and 360 (or 3.6) for sets and costumes

    Both values needed, in the same form. Values for venue hire and marketing are not required.

  3. 1 mark

    B1 for not correct: staff costs caused the largest part of the increase (440 > 360, or 4.4 of the 10.8 points), because staff has a much larger weight oe

    Needs the M1 (not adjacent, so not marked dependent); ft their values from a correct method. Must give a decision supported by a comparison of the effects of staff and of sets and costumes. B0 for 'no' with no supporting values. Answer only scores 0 (the question says you must show your working).

Question 4

4 marks

In 2021 a small hotel spent £15 600 on gas.

Using 2021 as the base year, the index number for the price the hotel pays for each kWh of gas is 152.0 in 2025

The hotel has fitted new boilers, so in 2025 it expects to use 15% less gas than in 2021

The hotel's budget for gas in 2025 is £21 000

The owner says,
"Our budget for 2025 will be enough to pay for our gas."

Assess the owner's statement.
You must show your working.

Model answer

If the hotel used the same amount of gas as in 2021, it would cost \(15600 \times 1.52 = \)£23 712

It expects to use 15% less, so the expected cost \(= 23712 \times 0.85 = \)£20 155.20

(Index number for the hotel's spending on gas: \(152 \times 0.85 = 129.2\); index number for the budget: \(\dfrac{21000}{15600} \times 100 = 134.6\))

£20 155.20 < £21 000, so the budget should be enough, with about £845 to spare. The owner is correct.

Explanation

Spending depends on both the price and the amount used, so its index number is the price index multiplied by the quantity multiplier: \(1.52 \times 0.85 = 1.292\), a 29.2% rise in spending. Subtracting the 15% from the index number (152 - 15 = 137) is a common error: the 15% saving applies to the higher 2025 cost, so subtracting overstates the cost (£21 372) and leads to the wrong decision. Comparing the expected cost with the budget then gives the decision.

Mark scheme
  1. 1 mark

    M1 for \(15600 \times 1.52\) (= 23 712) or \(15600 \times 0.85\) (= 13 260) or \(1.52 \times 0.85\) (= 1.292) oe

    For using one of the two changes correctly as a multiplier.

  2. 1 mark

    M1 for a complete method: \(15600 \times 1.52 \times 0.85\) oe, or \(152 \times 0.85\) (= 129.2, the index number for the hotel's spending on gas)

    Subtracting 15 from the index number (152 - 15 = 137, giving £21 372) or subtracting 15% of £15 600 from £23 712 (also £21 372) scores M1M0A0; both lead to the wrong conclusion that the budget is not enough.

  3. 1 mark

    A1 for £20 155.20 or 129.2

    Accept £20 155, £20 160 or £20 200 (rounded) from a correct method.

  4. 1 mark

    B1 for correct: the gas is expected to cost £20 155.20, which is less than the £21 000 budget (or 129.2 < 134.6, the index number for the budget) oe

    Needs the second M1 (not adjacent, so not marked dependent); ft their expected cost or spending index from a correct method. The budget index is \(\dfrac{21000}{15600} \times 100 = 134.6\) (134.615...). Must give a decision with a comparison. Answer only scores 0 (the question says you must show your working).

Ready to try the rest? Every answer you write is marked against the mark scheme, so you can see exactly where the marks are.

Study Helper Hints first, answers after you try

Stuck on this one? Ask for a hint and I’ll point you in the right direction, without giving the answer away. Once you’ve checked your answer, I’ll show you how the marks are awarded.