Level:
Correct: 0
Incorrect: 0
Marks: 0/0
Exam Practice
Course:
Topics:
Edexcel GCSE Statistics (Higher Paper 2) Smart practice A mixed round aimed at your weak spots
Unit 1
The statistical enquiry cycle
Statistical enquiry cycle stages 1 and 2; (a) Planning: 1a.01, 1a.02, 1a.03
Statistical enquiry cycle: planning and collecting
Statistical enquiry cycle stages 3, 4 and 5
Statistical enquiry cycle: interpreting and evaluating
Unit 2
The collection of data
(b) Types of data: 1b.01, 1b.02, 1b.03
Types of data and variables
(b) Types of data: 1b.04; (d) Collecting data: 1d.01, 1d.02
Primary and secondary data, reliability and validity
(c) Population and sampling: 1c.01, 1c.02, 1c.03
Populations, sampling frames and non-random sampling
(c) Population and sampling: 1c.04, 1c.05
Random and systematic sampling
(c) Population and sampling: 1c.06
Stratified sampling
(d) Collecting data: 1d.05, 1d.06
Problems with collected data and cleaning data
Unit 3
Processing, representing and analysing data
(a) Tabulation, diagrams and representation: 2a.01
Tabulation, tallies, pictograms and two-way tables
(a) Tabulation, diagrams and representation: 2a.01, 2a.02
Pie charts and comparative pie charts
(a) Tabulation, diagrams and representation: 2a.01
Stem and leaf diagrams
(a) Tabulation, diagrams and representation: 2a.02
Population pyramids, choropleth maps and 2D and 3D diagrams
(a) Tabulation, diagrams and representation: 2a.04
Histograms and frequency density
(a) Tabulation, diagrams and representation: 2a.05, 2a.06, 2a.07, 2a.08
Choosing representations and misleading diagrams
(a) Tabulation, diagrams and representation: 2a.09, 2a.10
Skewness
(b) Measures of central tendency: 2b.01, 2b.02, 2b.03
Mode, median and mean
(b) Measures of central tendency: 2b.01
Weighted mean and geometric mean
(c) Measures of dispersion: 2c.01, 2c.06
Standard deviation and standardised scores
(a) Tabulation, diagrams and representation: 2a.03; (c) Measures of dispersion: 2c.02, 2c.03
Box plots and outliers
(b) Measures of central tendency: 2b.03; (c) Measures of dispersion: 2c.04, 2c.05
Comparing distributions
(d) Further summary statistics: 2d.01
Index numbers
(d) Further summary statistics: 2d.02
Rates of change
(e) Scatter diagrams and correlation: 2e.01, 2e.02, 2e.03
Scatter diagrams, correlation and causation
(e) Scatter diagrams and correlation: 2e.04
Lines of best fit and regression lines
(e) Scatter diagrams and correlation: 2e.05, 2e.06, 2e.07, 2e.08
Spearman's rank and product moment correlation coefficients
(f) Time series: 2f.01, 2f.02; (b) 2b.01 mean seasonal variation
Time series, moving averages and seasonal variation
(g) Quality assurance: 2g.01, 2g.02
Quality assurance and control charts
(h) Estimation: 2h.01, 2h.02, 2h.03
Estimation, sample size and capture-recapture
Unit 4
Probability
3. Probability: 3p.01, 3p.02, 3p.03, 3p.04
Probability, expected frequency and risk
3. Probability: 3p.05, 3p.06, 3p.10
Experimental and theoretical probability and bias
3. Probability: 3p.11
Binomial distribution
3. Probability: 3p.12, 3p.13
Normal distribution
Avg
score:
–
Topics
done:
0/40

Experimental and theoretical probability and bias

Practise 12 exam-style questions on Experimental and theoretical probability and bias for Edexcel GCSE Statistics (Higher Paper 2). Write your answer as you would in the exam and get it marked in seconds against the mark scheme, point by point, with the Study Helper on hand if you get stuck.

  • 12 questions
  • 1–5 marks each
  • Instant marking
  • No sign-up needed
12 questions, marked as you go

Sample questions with model answers

Here are 4 of the questions in this topic, each with a model answer, an explanation of why it earns the marks and the mark scheme an examiner would use.

Question 1

1 mark

In a large secondary school, half of the students are girls.

Amir takes a random sample of 10 students from the school.
Bella takes a random sample of 100 students from the school.

Which sample is more likely to be at least 70% girls?

Choose your answer.

  • Amir's sample
  • Bella's sample
  • Both are equally likely
  • It is impossible to tell

Model answer

A small sample varies much more from the population than a large one.
In a sample of 10, getting 7 or more girls happens quite often (about 1 time in 6). In a sample of 100, the proportion of girls is almost always close to 50%, so 70% or more girls is very unlikely.
Answer: Amir's sample

Explanation

Larger random samples generally give better estimates of a population proportion, because the proportion in a large sample tends to be close to the population value. So an extreme sample proportion, such as 70% girls when the population has 50%, is much more likely in a small sample. A common misconception is that, because the population proportion is the same, both samples are equally likely to be extreme.

Mark scheme
  1. 1 mark

    B1 for Amir's sample cao

    Accept any unambiguous indication of Amir's sample (the sample of 10). 'Bella's sample' (the idea that a bigger sample gives more chances to pick girls), 'Both are equally likely' (the idea that the proportion of girls in a sample does not depend on the sample size) and 'It is impossible to tell' score B0. More than one option chosen scores B0. For information: the probabilities are about 0.17 for the sample of 10 and about 0.00004 for the sample of 100.
Question 2

2 marks

In a design and technology lesson, Ella and Jack each make a six-sided dice with a 3D printer. The faces of each dice are numbered 1 to 6.

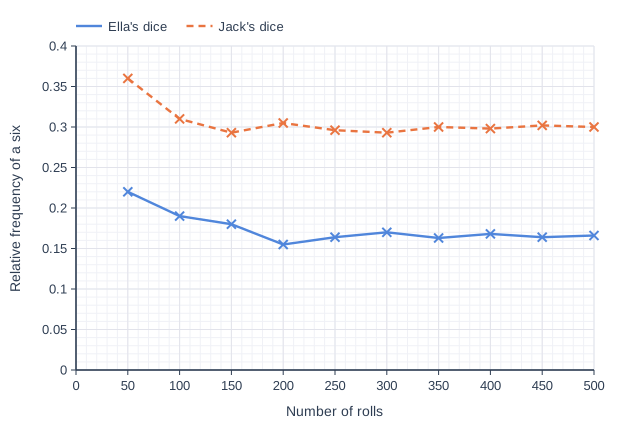
Each of them rolls their own dice 500 times. After every 50 rolls, they work out the relative frequency of a six so far.

The graph shows their results.

One of the dice may be biased.

State which dice may be biased, giving a reason for your answer.
Use the graph to estimate the probability that this dice lands on a six.

Line graph of relative frequency of a six (y-axis, 0 to 0.4) against number of rolls (x-axis, 0 to 500). "Ella's dice" joins the points (50, 0.22), (100, 0.19), (150, 0.18), (200, 0.155), (250, 0.164), (300, 0.17), (350, 0.163), (400, 0.168), (450, 0.164), (500, 0.166). "Jack's dice" (dashed) joins the points (50, 0.36), (100, 0.31), (150, 0.293), (200, 0.305), (250, 0.296), (300, 0.293), (350, 0.3), (400, 0.298), (450, 0.302), (500, 0.3).

Model answer

Jack's dice may be biased.
After many rolls, the relative frequency of a six for Ella's dice settles at about 0.17, close to \(\dfrac{1}{6}\), the probability for a fair dice. The relative frequency for Jack's dice settles at about 0.3, which is much more than \(\dfrac{1}{6}\), so it seems to land on six more often than a fair dice would.
Estimate of the probability that Jack's dice lands on a six: 0.3 (the relative frequency after 500 rolls).

Explanation

As the number of rolls increases, the relative frequency settles down, and for a fair dice it should settle close to the theoretical probability \(\dfrac{1}{6}\). A relative frequency that settles well away from \(\dfrac{1}{6}\) after many rolls suggests bias. The best estimate of the probability is the relative frequency based on the most rolls, here the value after 500 rolls, not an early value.

Mark scheme
  1. 1 mark

    B1 for Jack's dice, with a reason, e.g. after many rolls its relative frequency settles at about 0.3, which is much more than \(\dfrac{1}{6}\) (0.17), whereas the relative frequency for Ella's dice settles close to \(\dfrac{1}{6}\)

    oe. The reason must compare Jack's relative frequency (the value it settles at, or its value after many rolls) with \(\dfrac{1}{6}\) or 0.17, or with Ella's relative frequency together with the fact that hers is close to 0.17. B0 for Jack's dice with no reason, for 'Jack's line is higher' alone, or for a reason based only on the early rolls (e.g. 'it started at 0.36'). Answer-only rule for this question: A correct answer with no working scores this mark.

  2. 1 mark

    B1 for an estimate for Jack's dice of 0.3 (accept 0.29 to 0.31 inclusive)

    The best estimate is the relative frequency after 500 rolls (the most rolls). Award only for an estimate for Jack's dice. 0.36 (the value after 50 rolls) and \(\dfrac{1}{6}\) score B0. A correct answer with no working scores this mark. Probabilities must be fractions, decimals or percentages: ratio notation (e.g. 7 : 24) or 'out of' wording (e.g. '7 out of 24') scores A0/B0 for this mark (Pearson's general marking guidance).

Question 3

3 marks

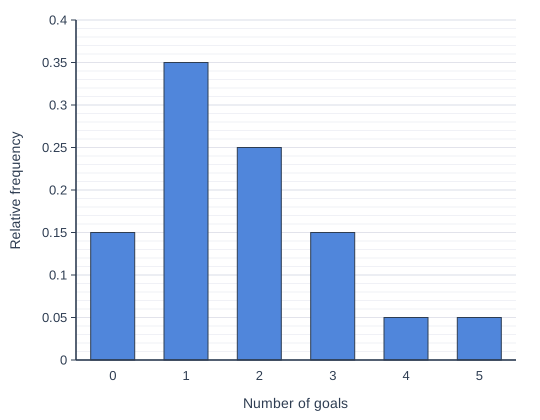
The bar chart shows the relative frequencies of the number of goals scored by a football team in each of its matches last season.

Given that the team scores at least one goal in a match, use the bar chart to estimate the probability that the team scores at least 3 goals in that match.
Give your answer correct to 2 decimal places.

Bar chart of relative frequency for each number of goals: 0 0.15, 1 0.35, 2 0.25, 3 0.15, 4 0.05, 5 0.05.

Model answer

P(at least 1 goal) = 1 - 0.15 = 0.85
P(at least 3 goals) = 0.15 + 0.05 + 0.05 = 0.25
P(at least 3 goals | at least 1 goal) = \(\dfrac{0.25}{0.85} = \dfrac{5}{17}\) = 0.294...
Answer: 0.29

Explanation

Relative frequencies can be used as estimates of probabilities. 'Given that the team scores at least one goal' means that only the matches with at least one goal count, so divide the relative frequency of 'at least 3 goals' by the relative frequency of 'at least 1 goal'. Common errors are to give 0.25, which ignores the condition, or to use only the bar for exactly 3 goals.

Mark scheme
  1. 1 mark

    M1 for P(at least 1 goal) = 1 - 0.15 (= 0.85) or P(at least 3 goals) = 0.15 + 0.05 + 0.05 (= 0.25)

    Either correct value or a correct sum seen. Equivalent working with frequencies is fine, e.g. if 40 matches are assumed: 34 matches with at least one goal or 10 with at least 3. Answer-only rule for this question: A correct answer with no working scores full marks.

  2. 1 mark

    M1 for their P(at least 3 goals) รท their P(at least 1 goal), e.g. \(\dfrac{0.25}{0.85}\)

    The numerator must be less than the denominator, and the denominator must be an attempt at P(at least 1 goal). \(\dfrac{0.15}{0.85}\) (exactly 3 goals) scores M1M1A0. 0.25 alone (ignoring the condition) scores M1M0A0. \(0.25 \times 0.85\) scores M1M0A0.

  3. 1 mark

    A1 for awrt 0.29

    Accept \(\dfrac{5}{17}\) or 0.294... If \(\dfrac{5}{17}\) or 0.294 is seen, ignore later rounding to 0.3; otherwise 0.3 scores A0. A correct answer with no working scores full marks. Probabilities must be fractions, decimals or percentages: ratio notation (e.g. 7 : 24) or 'out of' wording (e.g. '7 out of 24') scores A0/B0 for this mark (Pearson's general marking guidance).

Question 4

4 marks

In a board game, a player rolls two four-sided dice, each numbered 1, 2, 3 and 4. The player's score is the higher of the two numbers shown. If both dice show the same number, the score is that number.

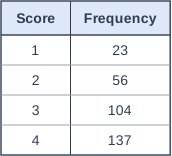
A games club records the scores in 320 turns. The table shows the results.

Leo says,
"A score of 4 happened more than 5 times as often as a score of 1, so the dice must be biased."

Assess Leo's statement. You must show your working.

Table with columns "Score", "Frequency". Score: 1; Frequency: 23 | Score: 2; Frequency: 56 | Score: 3; Frequency: 104 | Score: 4; Frequency: 137.

Model answer

If the dice are fair, there are 16 equally likely outcomes (first dice, second dice).
Score 1: (1, 1), so 1 outcome
Score 2: (1, 2), (2, 1), (2, 2), so 3 outcomes
Score 3: (1, 3), (2, 3), (3, 1), (3, 2), (3, 3), so 5 outcomes
Score 4: the other 7 outcomes
P(1) = \(\dfrac{1}{16}\), P(2) = \(\dfrac{3}{16}\), P(3) = \(\dfrac{5}{16}\), P(4) = \(\dfrac{7}{16}\)
Expected frequencies in 320 turns: \(320 \times \dfrac{1}{16}\) = 20, \(320 \times \dfrac{3}{16}\) = 60, \(320 \times \dfrac{5}{16}\) = 100, \(320 \times \dfrac{7}{16}\) = 140
Observed: 23, 56, 104, 137
The observed frequencies are all close to the expected frequencies (each within 4).
A score of 4 should happen about 7 times as often as a score of 1, so a score of 4 happening about 6 times as often is not evidence of bias.
Leo is wrong: the results do not suggest that the dice are biased.

Explanation

To judge bias, compare the observed frequencies with the frequencies that a fair model predicts. Here the scores are not equally likely: listing the 16 equally likely outcomes of the two dice shows that higher scores are more likely, so the expected frequencies are 20, 60, 100 and 140. Leo's mistake is to assume that every score should happen equally often. Small differences between observed and expected frequencies are expected by chance and are not evidence of bias.

Mark scheme
  1. 1 mark

    M1 for a correct method to find at least one theoretical probability, e.g. a sample space showing the 16 equally likely outcomes, or P(score of 4) = \(\dfrac{7}{16}\)

    Implied by any correct probability (\(\dfrac{1}{16}\), \(\dfrac{3}{16}\), \(\dfrac{5}{16}\), \(\dfrac{7}{16}\)) or any correct expected frequency. \(\dfrac{1}{4}\) for every score (assuming that the scores are equally likely) scores M0.

  2. 1 mark

    M1 for multiplying their probabilities by 320

    At least one product, with their probabilities from an attempt at the sample space (not \(\dfrac{1}{4}\) for every score). ALT: M1 for dividing the observed frequencies by 320 to compare relative frequencies with their probabilities, e.g. \(\dfrac{23}{320}\) (= 0.072).

  3. 1 mark

    A1 for all four expected frequencies 20, 60, 100, 140

    ALT: all four relative frequencies (awrt 0.072, 0.175, 0.325, 0.428) with all four probabilities (0.0625, 0.1875, 0.3125, 0.4375).

  4. 1 mark

    B1 for a correct assessment, e.g. Leo is wrong: the observed frequencies 23, 56, 104 and 137 are close to the expected frequencies 20, 60, 100 and 140, so the results do not suggest that the dice are biased; a score of 4 is expected 7 times as often as a score of 1

    ft their expected frequencies. Dependent on at least one M mark. A decision (Leo is wrong / there is no evidence of bias / the dice appear to be fair) and a comparison of the observed with the expected frequencies (at least two scores with values, or 'all are close' with the expected values seen) are needed. Accept 'Leo is wrong because the scores are not equally likely: 7 of the 16 outcomes give a score of 4 but only 1 gives a score of 1', with the expected frequencies seen. B0 for 'Leo is correct'. Answer only scores 0 (the question says 'You must show your working').

Ready to try the rest? Every answer you write is marked against the mark scheme, so you can see exactly where the marks are.

Study Helper Hints first, answers after you try

Stuck on this one? Ask for a hint and I’ll point you in the right direction, without giving the answer away. Once you’ve checked your answer, I’ll show you how the marks are awarded.