
Level:
Correct: 0
Incorrect: 0
Marks: 0/0
Exam Practice
Course:
Topics:
Edexcel GCSE Statistics (Higher Paper 2) Smart practice A mixed round aimed at your weak spots
Unit 1
The statistical enquiry cycle
Statistical enquiry cycle stages 1 and 2; (a) Planning: 1a.01, 1a.02, 1a.03
Statistical enquiry cycle: planning and collecting
Statistical enquiry cycle stages 3, 4 and 5
Statistical enquiry cycle: interpreting and evaluating
Unit 2
The collection of data
(b) Types of data: 1b.01, 1b.02, 1b.03
Types of data and variables
(b) Types of data: 1b.04; (d) Collecting data: 1d.01, 1d.02
Primary and secondary data, reliability and validity
(c) Population and sampling: 1c.01, 1c.02, 1c.03
Populations, sampling frames and non-random sampling
(c) Population and sampling: 1c.04, 1c.05
Random and systematic sampling
(c) Population and sampling: 1c.06
Stratified sampling
(d) Collecting data: 1d.05, 1d.06
Problems with collected data and cleaning data
Unit 3
Processing, representing and analysing data
(a) Tabulation, diagrams and representation: 2a.01
Tabulation, tallies, pictograms and two-way tables
(a) Tabulation, diagrams and representation: 2a.01, 2a.02
Pie charts and comparative pie charts
(a) Tabulation, diagrams and representation: 2a.01
Stem and leaf diagrams
(a) Tabulation, diagrams and representation: 2a.02
Population pyramids, choropleth maps and 2D and 3D diagrams
(a) Tabulation, diagrams and representation: 2a.04
Histograms and frequency density
(a) Tabulation, diagrams and representation: 2a.05, 2a.06, 2a.07, 2a.08
Choosing representations and misleading diagrams
(a) Tabulation, diagrams and representation: 2a.09, 2a.10
Skewness
(b) Measures of central tendency: 2b.01, 2b.02, 2b.03
Mode, median and mean
(b) Measures of central tendency: 2b.01
Weighted mean and geometric mean
(c) Measures of dispersion: 2c.01, 2c.06
Standard deviation and standardised scores
(a) Tabulation, diagrams and representation: 2a.03; (c) Measures of dispersion: 2c.02, 2c.03
Box plots and outliers
(b) Measures of central tendency: 2b.03; (c) Measures of dispersion: 2c.04, 2c.05
Comparing distributions
(d) Further summary statistics: 2d.01
Index numbers
(d) Further summary statistics: 2d.02
Rates of change
(e) Scatter diagrams and correlation: 2e.01, 2e.02, 2e.03
Scatter diagrams, correlation and causation
(e) Scatter diagrams and correlation: 2e.04
Lines of best fit and regression lines
(e) Scatter diagrams and correlation: 2e.05, 2e.06, 2e.07, 2e.08
Spearman's rank and product moment correlation coefficients
(f) Time series: 2f.01, 2f.02; (b) 2b.01 mean seasonal variation
Time series, moving averages and seasonal variation
(g) Quality assurance: 2g.01, 2g.02
Quality assurance and control charts
(h) Estimation: 2h.01, 2h.02, 2h.03
Estimation, sample size and capture-recapture
Unit 4
Probability
3. Probability: 3p.01, 3p.02, 3p.03, 3p.04
Probability, expected frequency and risk
3. Probability: 3p.05, 3p.06, 3p.10
Experimental and theoretical probability and bias
3. Probability: 3p.11
Binomial distribution
3. Probability: 3p.12, 3p.13
Normal distribution
Avg
score:
–
Topics
done:
0/40

Box plots and outliers

Practise 17 exam-style questions on Box plots and outliers for Edexcel GCSE Statistics (Higher Paper 2). Write your answer as you would in the exam and get it marked in seconds against the mark scheme, point by point, with the Study Helper on hand if you get stuck.

  • 17 questions
  • 1–5 marks each
  • Instant marking
  • No sign-up needed
17 questions, marked as you go

Sample questions with model answers

Here are 4 of the questions in this topic, each with a model answer, an explanation of why it earns the marks and the mark scheme an examiner would use.

Question 1

1 mark

A sensor in a field on a farm in England records the air temperature every hour. Here are the temperatures, in °C, that it recorded from 9 am to 4 pm on one day in May.

11.4   12.6   13.9   -99.9   15.2   15.8   16.1   15.5

Explain why -99.9 °C is likely to be an error rather than a genuine temperature.

Model answer

The readings either side are 13.9 °C and 15.2 °C, so the temperature cannot have dropped by more than 100 °C in an hour and then risen again. A temperature of -99.9 °C never happens in England, especially in May. The value is probably a code that the sensor records when it fails to take a reading.

Explanation

An outlier spotted by inspection is not automatically an error: you have to use the context. Here the value is physically impossible, so it must be an error (or a missing-data code) and should not be used in calculations such as the mean temperature. Saying only that it is very different from the other values gains no credit.

Mark scheme
  1. 1 mark

    B1 for a reason in context, e.g. the temperature could not fall by over 100 °C in an hour and be back up to 15.2 °C an hour later / no temperature anywhere near -99.9 °C happens in England (let alone in May) / -99.9 is likely to be a code recorded when the sensor gives no reading

    oe. The reason must use the context: what temperatures are possible, or the readings either side of it. B0 for 'it is an outlier', 'it is much lower than the other temperatures' or 'it is negative' alone (these only restate the data). Ignore any suggestion of what to do with the value.
Question 2

2 marks

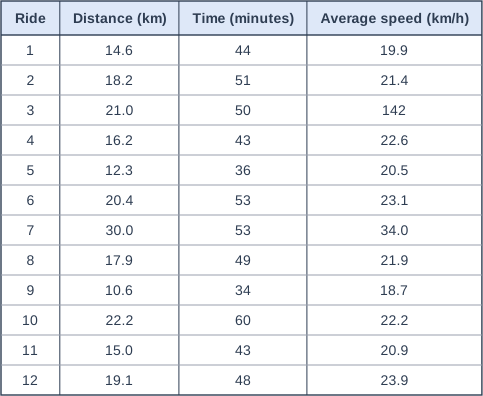
Sam has a cycle computer on his bike. For each ride, it records the distance, the time and the average speed. The table shows these for his last 12 rides.

Two of the average speeds, 142 km/h and 34.0 km/h, are outliers.

Use the distances and times in the table to comment on each of these outliers.

Table with columns "Ride", "Distance (km)", "Time (minutes)", "Average speed (km/h)". Ride: 1; Distance (km): 14.6; Time (minutes): 44; Average speed (km/h): 19.9 | Ride: 2; Distance (km): 18.2; Time (minutes): 51; Average speed (km/h): 21.4 | Ride: 3; Distance (km): 21.0; Time (minutes): 50; Average speed (km/h): 142 | Ride: 4; Distance (km): 16.2; Time (minutes): 43; Average speed (km/h): 22.6 | Ride: 5; Distance (km): 12.3; Time (minutes): 36; Average speed (km/h): 20.5 | Ride: 6; Distance (km): 20.4; Time (minutes): 53; Average speed (km/h): 23.1 | Ride: 7; Distance (km): 30.0; Time (minutes): 53; Average speed (km/h): 34.0 | Ride: 8; Distance (km): 17.9; Time (minutes): 49; Average speed (km/h): 21.9 | Ride: 9; Distance (km): 10.6; Time (minutes): 34; Average speed (km/h): 18.7 | Ride: 10; Distance (km): 22.2; Time (minutes): 60; Average speed (km/h): 22.2 | Ride: 11; Distance (km): 15.0; Time (minutes): 43; Average speed (km/h): 20.9 | Ride: 12; Distance (km): 19.1; Time (minutes): 48; Average speed (km/h): 23.9.

Model answer

142 km/h: ride 3 was 21 km in 50 minutes, and \(21 \div 50 \times 60 = 25.2\) km/h. So 142 km/h is an error (perhaps a fault in the cycle computer) and should be corrected to 25.2 km/h.
34.0 km/h: ride 7 was 30 km in 53 minutes, and \(30 \div 53 \times 60 = 34.0\) km/h. So this speed agrees with the distance and time: it is likely to be genuine, an unusually fast ride.

Explanation

An outlier may be a genuine unusual value or an error, and the other data recorded at the same time can often tell you which. Average speed = distance ÷ time, so checking each outlier against its own distance and time shows that one is impossible and the other is consistent. Saying only that a value is much bigger than the rest does not comment on it.

Mark scheme
  1. 1 mark

    B1 for 142 km/h is an error, because ride 3 was 21 km in 50 minutes, which is an average speed of about 25 km/h, not 142 km/h

    oe, e.g. 'it should be 25.2 km/h' or '21 km in 50 minutes is about 25 km/h, so the cycle computer made a mistake'. The comment must use the distance and time of ride 3, as the question asks. A reason that does not use the table, such as 'no cyclist could average 142 km/h', scores B0 on its own (ignore it if it is given with a correct comment). B0 for 'it is much bigger than the other speeds' or 'it is an outlier' alone (these only restate the data).

  2. 1 mark

    B1 for 34.0 km/h is likely to be genuine, e.g. ride 7 was 30 km in 53 minutes, which does give an average speed of about 34 km/h, so it was just an unusually fast ride

    The comment must use the distance and time of ride 7 to show that the speed agrees with them, as the question asks. Accept 'it was a fast ride (e.g. downhill or with the wind behind him), and 30 km in 53 minutes is about 34 km/h'. B0 for 'it is genuine' or 'it could be genuine' with no reference to the distance and time.

Question 3

3 marks

Volunteers at a beach clean each recorded the number of items of litter they collected. Here is some information about these numbers.

Least number = 12   Greatest number = 64
Median = 38   Upper quartile = 47   Interquartile range = 13

Megan is going to show the numbers in a box plot. She says, "My box plot will not need to show any outliers."

Is Megan correct? You must show your working.

Model answer

Lower quartile = 47 - 13 = 34
\(1.5 \times 13 = 19.5\)
Lower limit = 34 - 19.5 = 14.5
Upper limit = 47 + 19.5 = 66.5
12 < 14.5, so the least number, 12, is an outlier. (64 < 66.5, so the greatest number is not.)
Megan is not correct: her box plot should show 12 as an outlier.

Explanation

The lower quartile comes from the upper quartile and the interquartile range, not from the median. The outlier limits are then 1.5 times the IQR below the lower quartile and above the upper quartile. Many students check only the greatest value, but here it is the least value that is an outlier.

Mark scheme
  1. 1 mark

    B1 for lower quartile 34

    47 - 13. May be implied by a correct lower limit of 14.5. B0 for 25 (median - IQR).

  2. 1 mark

    M1 for \(34 - 1.5 \times 13\) or \(47 + 1.5 \times 13\)

    oe, e.g. \(1.5 \times 13 = 19.5\) subtracted from their lower quartile or added to the upper quartile. ft their lower quartile. Adding to or subtracting from the median is M0.

  3. 1 mark

    A1 for lower limit 14.5 and the conclusion that Megan is not correct, because the least number, 12, is less than 14.5, so it is an outlier

    The comparison (12 < 14.5) must be stated in symbols or words. The upper limit, 66.5, is not needed for this mark, but if it is given it must be correct (64 < 66.5, so the greatest number is not an outlier). Answer only ('No') scores 0, as the question says 'You must show your working'.

Question 4

4 marks

A machine makes bolts. The lengths of the bolts are modelled by a normal distribution with mean 50.0 mm and standard deviation 0.4 mm.

An inspector recorded the lengths, in mm, of 8 bolts made by the machine.

49.6   50.3   5.02   50.1   49.8   51.6   50.4   49.9

Using the mean and the standard deviation of this normal distribution, identify any outliers. Comment on each outlier in context. You must show your working.

Model answer

\(3 \times 0.4 = 1.2\)
Lower limit = 50.0 - 1.2 = 48.8 mm
Upper limit = 50.0 + 1.2 = 51.2 mm
5.02 < 48.8 and 51.6 > 51.2, so 5.02 and 51.6 are outliers. All the other lengths are between 48.8 and 51.2.
5.02 mm is almost certainly a recording error: the decimal point is in the wrong place, and the length was probably 50.2 mm.
51.6 mm could be a genuine length: the machine may have made a bolt that is too long. It should not be removed; the inspector should check the bolt and the machine.

Explanation

For data modelled by a normal distribution, an outlier is a value more than 3 standard deviations from the mean. Then use the context: one outlier is impossible and has an obvious cause, but the other is a possible length that may show that the machine has a fault, so removing it would hide useful information.

Mark scheme
  1. 1 mark

    M1 for \(50.0 - 3 \times 0.4\) or \(50.0 + 3 \times 0.4\)

    oe. Using 2 standard deviations (49.2 and 50.8) or 1.5 standard deviations is M0.

  2. 1 mark

    A1 for limits 48.8 and 51.2, with 5.02 and 51.6 identified as the outliers (and no others)

    Both limits and both outliers needed. Outliers named with no limits score M0A0, as the question says 'You must show your working'; the two marks below can still be scored.

  3. 1 mark

    B1 for 5.02 is a recording error, e.g. the decimal point is in the wrong place and the length was probably 50.2 mm

    oe. Must refer to the context, e.g. 'no bolt from this machine would be a tenth of the usual length'. Accept 'it should be checked and corrected (to 50.2)'. B0 for 'it is an error because it is an outlier' or 'it is too small' alone.

  4. 1 mark

    B1 for 51.6 could be a genuine length, e.g. the machine may have made a faulty bolt that is too long, so it should be kept (not removed) and the machine checked

    Must treat 51.6 as possibly genuine and refer to the context (the machine or the bolt). B0 for 'it is an error' or 'remove it' with no further reason. Ignore extraneous non-contradictory comments.

Ready to try the rest? Every answer you write is marked against the mark scheme, so you can see exactly where the marks are.

Study Helper Hints first, answers after you try

Stuck on this one? Ask for a hint and I’ll point you in the right direction, without giving the answer away. Once you’ve checked your answer, I’ll show you how the marks are awarded.