Level:
Correct: 0
Incorrect: 0
Marks: 0/0
Exam Practice
Course:
Topics:
Edexcel GCSE Statistics (Higher Paper 2) Smart practice A mixed round aimed at your weak spots
Unit 1
The statistical enquiry cycle
Statistical enquiry cycle stages 1 and 2; (a) Planning: 1a.01, 1a.02, 1a.03
Statistical enquiry cycle: planning and collecting
Statistical enquiry cycle stages 3, 4 and 5
Statistical enquiry cycle: interpreting and evaluating
Unit 2
The collection of data
(b) Types of data: 1b.01, 1b.02, 1b.03
Types of data and variables
(b) Types of data: 1b.04; (d) Collecting data: 1d.01, 1d.02
Primary and secondary data, reliability and validity
(c) Population and sampling: 1c.01, 1c.02, 1c.03
Populations, sampling frames and non-random sampling
(c) Population and sampling: 1c.04, 1c.05
Random and systematic sampling
(c) Population and sampling: 1c.06
Stratified sampling
(d) Collecting data: 1d.05, 1d.06
Problems with collected data and cleaning data
Unit 3
Processing, representing and analysing data
(a) Tabulation, diagrams and representation: 2a.01
Tabulation, tallies, pictograms and two-way tables
(a) Tabulation, diagrams and representation: 2a.01, 2a.02
Pie charts and comparative pie charts
(a) Tabulation, diagrams and representation: 2a.01
Stem and leaf diagrams
(a) Tabulation, diagrams and representation: 2a.02
Population pyramids, choropleth maps and 2D and 3D diagrams
(a) Tabulation, diagrams and representation: 2a.04
Histograms and frequency density
(a) Tabulation, diagrams and representation: 2a.05, 2a.06, 2a.07, 2a.08
Choosing representations and misleading diagrams
(a) Tabulation, diagrams and representation: 2a.09, 2a.10
Skewness
(b) Measures of central tendency: 2b.01, 2b.02, 2b.03
Mode, median and mean
(b) Measures of central tendency: 2b.01
Weighted mean and geometric mean
(c) Measures of dispersion: 2c.01, 2c.06
Standard deviation and standardised scores
(a) Tabulation, diagrams and representation: 2a.03; (c) Measures of dispersion: 2c.02, 2c.03
Box plots and outliers
(b) Measures of central tendency: 2b.03; (c) Measures of dispersion: 2c.04, 2c.05
Comparing distributions
(d) Further summary statistics: 2d.01
Index numbers
(d) Further summary statistics: 2d.02
Rates of change
(e) Scatter diagrams and correlation: 2e.01, 2e.02, 2e.03
Scatter diagrams, correlation and causation
(e) Scatter diagrams and correlation: 2e.04
Lines of best fit and regression lines
(e) Scatter diagrams and correlation: 2e.05, 2e.06, 2e.07, 2e.08
Spearman's rank and product moment correlation coefficients
(f) Time series: 2f.01, 2f.02; (b) 2b.01 mean seasonal variation
Time series, moving averages and seasonal variation
(g) Quality assurance: 2g.01, 2g.02
Quality assurance and control charts
(h) Estimation: 2h.01, 2h.02, 2h.03
Estimation, sample size and capture-recapture
Unit 4
Probability
3. Probability: 3p.01, 3p.02, 3p.03, 3p.04
Probability, expected frequency and risk
3. Probability: 3p.05, 3p.06, 3p.10
Experimental and theoretical probability and bias
3. Probability: 3p.11
Binomial distribution
3. Probability: 3p.12, 3p.13
Normal distribution
Avg
score:
–
Topics
done:
0/40

Time series, moving averages and seasonal variation

Practise 14 exam-style questions on Time series, moving averages and seasonal variation for Edexcel GCSE Statistics (Higher Paper 2). Write your answer as you would in the exam and get it marked in seconds against the mark scheme, point by point, with the Study Helper on hand if you get stuck.

  • 14 questions
  • 1–5 marks each
  • Instant marking
  • No sign-up needed
14 questions, marked as you go

Sample questions with model answers

Here are 4 of the questions in this topic, each with a model answer, an explanation of why it earns the marks and the mark scheme an examiner would use.

Question 1

1 mark

A tax advice helpline records the number of calls it receives each quarter.

The 4-point moving average for the four quarters of 2024 (Quarter 1 to Quarter 4) is 1837.5

Work out the total number of calls the helpline received in 2024

Model answer

4-point moving average \(= \dfrac{\text{total of the four quarters}}{4}\)

Total for 2024 \(= 4 \times 1837.5 = 7350\)

7350 calls

Explanation

Each 4-point moving average is the mean of four consecutive quarters, so multiplying it by 4 gives their total. When the four quarters are the four quarters of one year, this is the total for that year. A moving average is never the value for a single quarter.

Mark scheme
  1. 1 mark

    B1 for 7350

    cao. A 4-point moving average is the total of four consecutive values divided by 4, so the total for 2024 is \(4 \times 1837.5\).
Question 2

2 marks

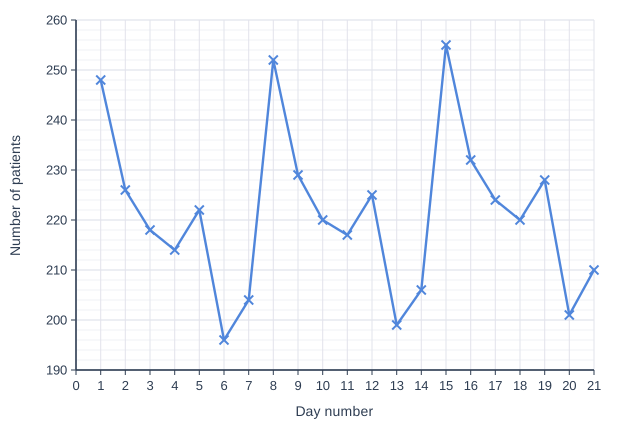
The graph shows the number of patients who came to the emergency department of a hospital each day for three weeks. Day 1 was a Monday.

Describe the trend in the number of patients.
Describe the weekly pattern in the number of patients.

Line graph of number of patients (y-axis, 190 to 260) against day number (x-axis, 0 to 21). The line joins the points (1, 248), (2, 226), (3, 218), (4, 214), (5, 222), (6, 196), (7, 204), (8, 252), (9, 229), (10, 220), (11, 217), (12, 225), (13, 199), (14, 206), (15, 255), (16, 232), (17, 224), (18, 220), (19, 228), (20, 201), (21, 210).

Model answer

Trend: the number of patients coming to the emergency department each day is increasing slightly over the three weeks (for example, about 248, 252 and 255 on the three Mondays).

Weekly pattern: the department is busiest on Mondays (days 1, 8 and 15) and quietest on Saturdays (days 6, 13 and 20). The pattern repeats every week.

Explanation

A time series can show a trend (the general direction over time) and a repeating pattern at the same time. Here the pattern repeats every 7 days, so it is a weekly cycle, and 7-point moving averages would remove it to show the trend. Describe each feature in context, naming the days, rather than listing every rise and fall.

Mark scheme
  1. 1 mark

    B1 for the trend: the number of patients coming to the department each day is increasing slightly (gradually) over the three weeks oe

    Accept 'a slight upward trend' or 'it is rising slowly'. B0 for 'positive correlation' on its own, or for a day-by-day description of the ups and downs.

  2. 1 mark

    B1 for the weekly pattern: the number of patients is highest on Mondays and lowest on Saturdays, every week oe

    Must identify at least one feature of the pattern by day of the week (or by day numbers 1, 8 and 15, or 6, 13 and 20). Accept 'busiest on Mondays' or 'quietest on Saturdays' or 'the pattern repeats every 7 days, with a peak each Monday'. B0 for a description of the overall trend only.

Question 3

3 marks

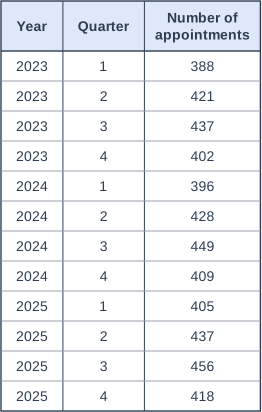
A vet's surgery recorded the number of appointments it had each quarter from 2023 to 2025. The table shows this information.

The 4-point moving averages for these data, in time order, are

412   414   \(p\)   418.75   420.5   \(q\)   425   426.75   429

Work out the values of \(p\) and \(q\).
Use the moving averages to describe the trend in the number of appointments.

Table with columns "Year", "Quarter", "Number of appointments". Year: 2023; Quarter: 1; Number of appointments: 388 | Year: 2023; Quarter: 2; Number of appointments: 421 | Year: 2023; Quarter: 3; Number of appointments: 437 | Year: 2023; Quarter: 4; Number of appointments: 402 | Year: 2024; Quarter: 1; Number of appointments: 396 | Year: 2024; Quarter: 2; Number of appointments: 428 | Year: 2024; Quarter: 3; Number of appointments: 449 | Year: 2024; Quarter: 4; Number of appointments: 409 | Year: 2025; Quarter: 1; Number of appointments: 405 | Year: 2025; Quarter: 2; Number of appointments: 437 | Year: 2025; Quarter: 3; Number of appointments: 456 | Year: 2025; Quarter: 4; Number of appointments: 418.

Model answer

\(p\) is the 3rd moving average (2023 Quarter 3 to 2024 Quarter 2):
\(p = \dfrac{437 + 402 + 396 + 428}{4} = \dfrac{1663}{4} = 415.75\)

\(q\) is the 6th moving average (2024 Quarter 2 to 2025 Quarter 1):
\(q = \dfrac{428 + 449 + 409 + 405}{4} = \dfrac{1691}{4} = 422.75\)

The moving averages increase steadily, from 412 to 429, so the trend is upwards: the number of appointments at the surgery is increasing, by about 2 appointments each quarter.

Explanation

Each 4-point moving average is the mean of four consecutive quarters, so the 3rd one starts at the 3rd quarter. Counting along the list carefully is the main source of errors. Because each moving average contains one value from each quarter, the seasonal pattern is removed and the moving averages show the trend.

Mark scheme
  1. 1 mark

    B1 for \(p = 415.75\)

    cao. \(p = \dfrac{437 + 402 + 396 + 428}{4}\) (2023 Quarter 3 to 2024 Quarter 2). Accept 415.8 if \(\dfrac{1663}{4}\) is seen.

  2. 1 mark

    B1 for \(q = 422.75\)

    cao. \(q = \dfrac{428 + 449 + 409 + 405}{4}\) (2024 Quarter 2 to 2025 Quarter 1). Accept 422.8 if \(\dfrac{1691}{4}\) is seen.

  3. 1 mark

    B1 for the trend is upwards: the number of appointments is increasing (by about 2 a quarter) oe

    Must be in context (appointments). Accept 'the moving averages increase every time, so the number of appointments is going up steadily'. Do not require the rate. B0 for 'positive correlation' on its own. Independent of the values of p and q.

Question 4

4 marks

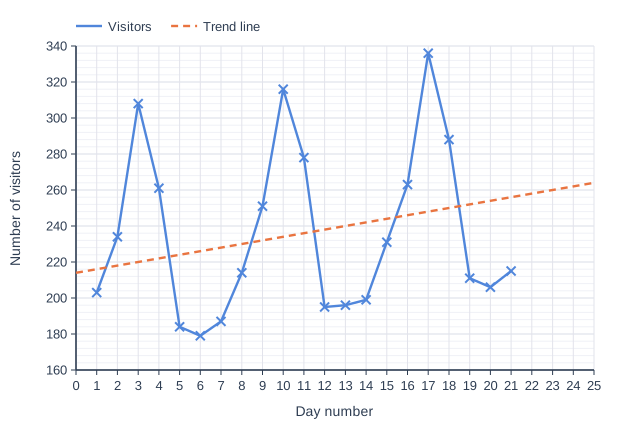
A trampoline park recorded the number of visitors it had each day for three weeks. Day 1 was a Thursday, so days 3, 10 and 17 were Saturdays.

The graph shows this information and a trend line.

The numbers of visitors on the three Saturdays were 308, 316 and 336

Use the trend line to work out the mean seasonal variation for Saturdays, and use it to predict the number of visitors on day 24, the next Saturday.
You must show your working.

Line graph of number of visitors (y-axis, 160 to 340) against day number (x-axis, 0 to 25). "Visitors" joins the points (1, 203), (2, 234), (3, 308), (4, 261), (5, 184), (6, 179), (7, 187), (8, 214), (9, 251), (10, 316), (11, 278), (12, 195), (13, 196), (14, 199), (15, 231), (16, 263), (17, 336), (18, 288), (19, 211), (20, 206), (21, 215). "Trend line" (dashed) joins the points (0, 214), (25, 264).

Model answer

Trend line values on the Saturdays: day 3: 220, day 10: 234, day 17: 248

Seasonal variations (actual - trend):
308 - 220 = 88
316 - 234 = 82
336 - 248 = 88

Mean seasonal variation for Saturdays \(= \dfrac{88 + 82 + 88}{3} = 86\)

Trend line value at day 24 = 262

Prediction \(= 262 + 86 = 348\)

About 348 visitors

Explanation

The same method works for any repeating pattern, here a weekly one: seasonal variation = actual - trend for each Saturday, find their mean, then add it to the trend line value for the day you want to predict. The trend line has to be extended to day 24 and read there. Averaging the Saturday values themselves ignores the rising trend and is a common error.

Mark scheme
  1. 1 mark

    M1 for at least two seasonal variations for Saturdays using the trend line: \(308 - 220\) (= 88), \(316 - 234\) (= 82), \(336 - 248\) (= 88)

    Allow a reading of the trend line within 2 (half a small square) of each value: 218 to 222 at day 3, 232 to 236 at day 10, 246 to 250 at day 17.

  2. 1 mark

    M1 for the mean of their three Saturday seasonal variations, eg \(\dfrac{88 + 82 + 88}{3}\) (= 86)

    The mean of the three Saturday values themselves, \(\dfrac{308 + 316 + 336}{3}\) (= 320), does not use the trend and scores M0 for this and the first mark.

  3. 1 mark

    M1 for the trend line value at day 24 (262) plus their mean seasonal variation, eg \(262 + 86\)

    Allow a reading of 260 to 264 at day 24. Adding their mean seasonal variation to 336 (the last Saturday) scores M0.

  4. 1 mark

    A1 for an answer in the range 344 to 352 (348 from exact readings)

    Must be a whole number of visitors from correct working. Answer without working scores M0M0M0A0 (the question says you must show your working).

Ready to try the rest? Every answer you write is marked against the mark scheme, so you can see exactly where the marks are.

Study Helper Hints first, answers after you try

Stuck on this one? Ask for a hint and I’ll point you in the right direction, without giving the answer away. Once you’ve checked your answer, I’ll show you how the marks are awarded.