
Level:
Correct: 0
Incorrect: 0
Marks: 0/0
Exam Practice
Course:
Topics:
Edexcel GCSE Statistics (Higher Paper 2) Smart practice A mixed round aimed at your weak spots
Unit 1
The statistical enquiry cycle
Statistical enquiry cycle stages 1 and 2; (a) Planning: 1a.01, 1a.02, 1a.03
Statistical enquiry cycle: planning and collecting
Statistical enquiry cycle stages 3, 4 and 5
Statistical enquiry cycle: interpreting and evaluating
Unit 2
The collection of data
(b) Types of data: 1b.01, 1b.02, 1b.03
Types of data and variables
(b) Types of data: 1b.04; (d) Collecting data: 1d.01, 1d.02
Primary and secondary data, reliability and validity
(c) Population and sampling: 1c.01, 1c.02, 1c.03
Populations, sampling frames and non-random sampling
(c) Population and sampling: 1c.04, 1c.05
Random and systematic sampling
(c) Population and sampling: 1c.06
Stratified sampling
(d) Collecting data: 1d.05, 1d.06
Problems with collected data and cleaning data
Unit 3
Processing, representing and analysing data
(a) Tabulation, diagrams and representation: 2a.01
Tabulation, tallies, pictograms and two-way tables
(a) Tabulation, diagrams and representation: 2a.01, 2a.02
Pie charts and comparative pie charts
(a) Tabulation, diagrams and representation: 2a.01
Stem and leaf diagrams
(a) Tabulation, diagrams and representation: 2a.02
Population pyramids, choropleth maps and 2D and 3D diagrams
(a) Tabulation, diagrams and representation: 2a.04
Histograms and frequency density
(a) Tabulation, diagrams and representation: 2a.05, 2a.06, 2a.07, 2a.08
Choosing representations and misleading diagrams
(a) Tabulation, diagrams and representation: 2a.09, 2a.10
Skewness
(b) Measures of central tendency: 2b.01, 2b.02, 2b.03
Mode, median and mean
(b) Measures of central tendency: 2b.01
Weighted mean and geometric mean
(c) Measures of dispersion: 2c.01, 2c.06
Standard deviation and standardised scores
(a) Tabulation, diagrams and representation: 2a.03; (c) Measures of dispersion: 2c.02, 2c.03
Box plots and outliers
(b) Measures of central tendency: 2b.03; (c) Measures of dispersion: 2c.04, 2c.05
Comparing distributions
(d) Further summary statistics: 2d.01
Index numbers
(d) Further summary statistics: 2d.02
Rates of change
(e) Scatter diagrams and correlation: 2e.01, 2e.02, 2e.03
Scatter diagrams, correlation and causation
(e) Scatter diagrams and correlation: 2e.04
Lines of best fit and regression lines
(e) Scatter diagrams and correlation: 2e.05, 2e.06, 2e.07, 2e.08
Spearman's rank and product moment correlation coefficients
(f) Time series: 2f.01, 2f.02; (b) 2b.01 mean seasonal variation
Time series, moving averages and seasonal variation
(g) Quality assurance: 2g.01, 2g.02
Quality assurance and control charts
(h) Estimation: 2h.01, 2h.02, 2h.03
Estimation, sample size and capture-recapture
Unit 4
Probability
3. Probability: 3p.01, 3p.02, 3p.03, 3p.04
Probability, expected frequency and risk
3. Probability: 3p.05, 3p.06, 3p.10
Experimental and theoretical probability and bias
3. Probability: 3p.11
Binomial distribution
3. Probability: 3p.12, 3p.13
Normal distribution
Avg
score:
–
Topics
done:
0/40

Rates of change

Practise 13 exam-style questions on Rates of change for Edexcel GCSE Statistics (Higher Paper 2). Write your answer as you would in the exam and get it marked in seconds against the mark scheme, point by point, with the Study Helper on hand if you get stuck.

  • 13 questions
  • 1–5 marks each
  • Instant marking
  • No sign-up needed
13 questions, marked as you go

Sample questions with model answers

Here are 4 of the questions in this topic, each with a model answer, an explanation of why it earns the marks and the mark scheme an examiner would use.

Question 1

1 mark

\(\text{crude death rate} = \dfrac{\text{number of deaths}}{\text{total population}} \times 1000\)

\(\text{standardised death rate} = \dfrac{\sum (\text{death rate for the age group} \times \text{standard population for the age group})}{1000}\)
where the standard population gives the number of people in each age group out of every 1000 people.

In 2024, Town X had a crude death rate of 14.2 and a standardised death rate of 9.1

What is the most likely reason for the difference between these two rates?

Choose your answer.

  • Town X has a larger population than the standard population
  • Town X has a larger proportion of older people than the standard population
  • Town X has a higher birth rate than most towns
  • The crude death rate has been worked out wrongly

Model answer

The standardised death rate shows what the death rate would be if Town X had the age structure of the standard population. Its crude death rate is much higher, so Town X must have more people in the age groups with high death rates, the older age groups, than the standard population has.

Town X has a larger proportion of older people than the standard population

Explanation

Death rates are much higher in older age groups. A town with many older people (for example a retirement town) has a high crude death rate, but its standardised death rate, which uses the standard population's age structure, can be much lower. Both rates are per 1000 people, so the size of the town makes no difference.

Mark scheme
  1. 1 mark

    B1 for Town X has a larger proportion of older people than the standard population

    cao. Accept the option described in words, eg 'Town X has more old people than the standard population'. B0 if more than one option is chosen. The size of the population does not affect either rate (both are per 1000 people); the birth rate is not used in either rate; and a crude rate is not a wrong rate.
Question 2

2 marks

\(\text{crude death rate} = \dfrac{\text{number of deaths}}{\text{total population}} \times 1000\)

The crude death rate for a rural district rose from 10.2 in 2015 to 10.8 in 2025
However, fewer people died in the district in 2025 than in 2015

Explain how both of these statements can be true.

Model answer

The crude death rate is the number of deaths per 1000 people, so it depends on the population as well as on the number of deaths.

The population of the district must have fallen from 2015 to 2025, for example because people moved away. If the population fell by a greater percentage than the number of deaths fell, there were more deaths for every 1000 people, so the rate went up even though there were fewer deaths.

(For example, 653 deaths in 64 000 people is 10.2 per 1000, and 626 deaths in 58 000 people is 10.8 per 1000)

Explanation

A rate per 1000 people can rise while the number it counts falls, if the population falls faster. So a higher crude death rate does not mean more deaths. Pick numbers to check an argument like this: fewer deaths divided by a much smaller population can give a larger rate.

Mark scheme
  1. 1 mark

    B1 for the population of the district must have fallen (decreased) from 2015 to 2025 oe

    Accept 'fewer people lived in the district in 2025' or 'people moved away from the district'.

  2. 1 mark

    B1 for the population fell by a greater percentage (proportion) than the number of deaths fell, so the number of deaths per 1000 people went up oe

    Must compare the changes proportionally, or explain that each death is a larger fraction of the smaller population. Accept 'the population went down a lot, so even with fewer deaths there were more deaths for every 1000 people'. B0 for 'the population fell by more than the deaths fell' comparing the numbers of people only. B0 for statements that the rates or the data must be wrong.

Question 3

3 marks

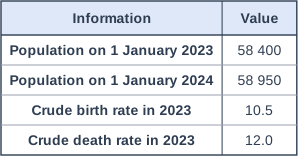
The table gives information about the population of a market town in 2023

\(\text{crude birth rate} = \dfrac{\text{number of births}}{\text{total population}} \times 1000\)   \(\text{crude death rate} = \dfrac{\text{number of deaths}}{\text{total population}} \times 1000\)

For 2023, use the population on 1 January 2023 as the total population.

Net migration is the number of people who moved into the town minus the number of people who moved out.

Work out the net migration for the town in 2023

Table with columns "Information", "Value". Information: Population on 1 January 2023; Value: 58 400 | Information: Population on 1 January 2024; Value: 58 950 | Information: Crude birth rate in 2023; Value: 10.5 | Information: Crude death rate in 2023; Value: 12.0.

Model answer

Births \(= \dfrac{10.5 \times 58400}{1000} = 613.2\), about 613
Deaths \(= \dfrac{12.0 \times 58400}{1000} = 700.8\), about 701

So there were 701 - 613 = 88 more deaths than births.

The population went up by 58 950 - 58 400 = 550

Without migration the population would have fallen by 88, so
net migration = 550 + 88 = 638

638 people

Explanation

Population change = births - deaths + net migration. Use the crude rates with the starting population to find the births and the deaths, then the migration is whatever is needed to explain the rest of the change. Here deaths were more than births, so more than 550 people must have moved in (net) for the population to grow by 550; subtracting 88 instead of adding it is the usual error.

Mark scheme
  1. 1 mark

    M1 for the number of births or of deaths, eg \(10.5 \times 58400 \div 1000\) (= 613.2) or \(12.0 \times 58400 \div 1000\) (= 700.8), or for deaths minus births \((12.0 - 10.5) \times 58400 \div 1000\) (= 87.6)

    Accept 613 or 701 seen. Answer-only rule for this question: A correct answer with no working scores 3 marks.

  2. 1 mark

    M1 for a complete method, eg \((58950 - 58400) + (\text{their deaths} - \text{their births})\) (= 550 + 87.6), or \(58950 - (58400 + 613 - 701)\)

    The population rose by 550 even though deaths were 87.6 more than births, so the net migration must be more than 550. 550 - 87.6 (= 462.4) scores M1M0A0.

  3. 1 mark

    A1 for 638

    Accept 637 or 638 (from rounding or truncating the numbers of births and deaths). 637.6 not rounded to a whole number scores M1M1A0. A correct answer with no working scores 3 marks.

Question 4

4 marks

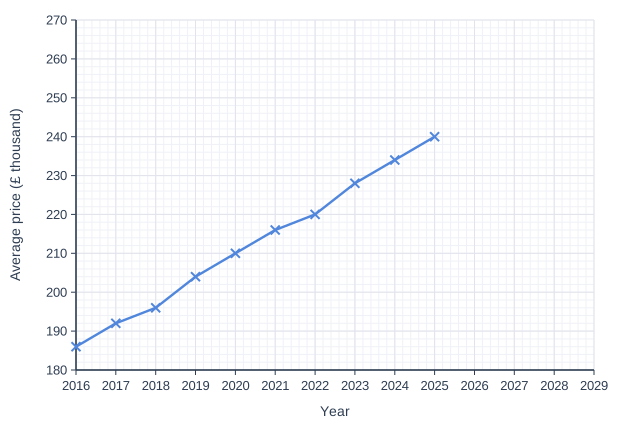
The graph shows the average price, in thousands of pounds, of a two-bedroom flat in a city in June of each year from 2016 to 2025

Mo wants to buy a two-bedroom flat at the average price in June 2028. He will need a deposit of 10% of the price. By June 2028 he will have saved £24 000

Mo says,
"If flat prices keep rising in the same way as from 2016 to 2025, I will have enough for the deposit in June 2028."

Assess Mo's statement.
Give one reason why your conclusion may not be reliable.
You must show your working.

Line graph of average price (£ thousand) (y-axis, 180 to 270) against year (x-axis, 2016 to 2029). The line joins the points (2016, 186), (2017, 192), (2018, 196), (2019, 204), (2020, 210), (2021, 216), (2022, 220), (2023, 228), (2024, 234), (2025, 240).

Model answer

From 2016 to 2025 the average price rose from £186 000 to £240 000, a rise of £54 000 in 9 years, which is £6000 each year.

Average price in June 2028 \(\approx 240 + 3 \times 6 = 258\) thousand pounds

Deposit needed \(= 10\% \times 258000 = \)£25 800

£25 800 > £24 000, so Mo will not have enough for the deposit. His statement is not correct.

This may not be reliable: the 2028 price is found by extrapolation, beyond the range of the data, and flat prices may not keep rising at the same rate.

Explanation

To predict beyond the data, continue the trend: work out the average rise per year from the graph (or extend a line of best fit) and add it on for each extra year. Using the 2025 price ignores the rising trend and makes Mo's savings look just enough, which is the common error. A prediction made by extrapolating a trend assumes that the trend continues, which may not happen.

Mark scheme
  1. 1 mark

    M1 for a method that continues the trend to June 2028, eg the mean rise per year \((240 - 186) \div 9 = 6\) (thousand pounds) then \(240 + 3 \times 6\), or a line of best fit extended to 2028

    Accept a rise per year from 5.5 to 7 thousand pounds from a correct method (eg from 2022 to 2025: \((240 - 220) \div 3 = 6.67\)). Using the 2025 price (£240 000) as the 2028 price does not continue the trend: M0A0 (it gives a deposit of exactly £24 000).

  2. 1 mark

    A1 for an average price in June 2028 from 254 to 262 thousand pounds (258 from a rise of 6 thousand pounds a year)

    Accept £254 000 to £262 000. A 2028 price with no method shown scores M0A0 (the question says you must show your working).

  3. 1 mark

    B1 for not correct: 10% of their 2028 price (eg £25 800) is more than £24 000, so Mo will not have enough for the deposit oe

    Needs the M1 (not adjacent, so not marked dependent); ft their 2028 price if it is more than 240 thousand pounds. Must give a decision supported by comparing 10% of the predicted price with £24 000 (or £24 000 with 10% of their price). Answer only scores 0 for this mark (the question says you must show your working).

  4. 1 mark

    B1 for a reason, eg the 2028 price is found by extrapolation (beyond the range of the data), so prices may not keep rising in the same way (they could rise faster or slower, or fall) oe

    May be scored independently of the calculation. Accept 'the trend may change' or 'prices did not rise by exactly the same amount every year'. B0 for 'it is only a prediction' or 'the graph might be wrong' with no reason, and for reasons that are not about the data, eg 'Mo might not save enough'.

Ready to try the rest? Every answer you write is marked against the mark scheme, so you can see exactly where the marks are.

Study Helper Hints first, answers after you try

Stuck on this one? Ask for a hint and I’ll point you in the right direction, without giving the answer away. Once you’ve checked your answer, I’ll show you how the marks are awarded.