Question 1
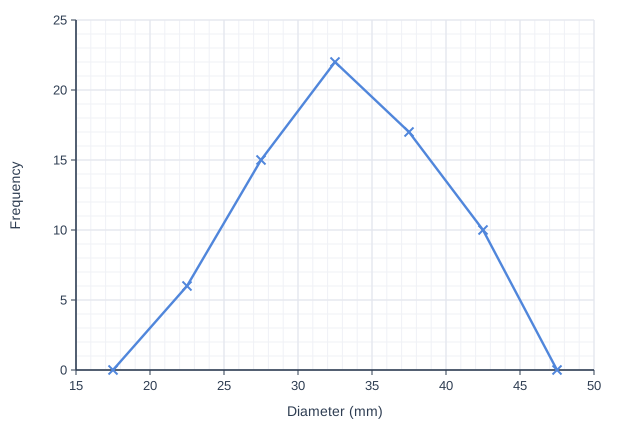
1 markMaisie measured the diameters, d mm, of 70 conkers. She grouped the diameters into five classes, from \(20 < d \le 25\) up to \(40 < d \le 45\).
The diagram shows the frequency polygon she drew.
Explain why her frequency polygon meets the horizontal axis at d = 17.5 and at d = 47.5
Model answer
Maisie has drawn a closed frequency polygon. The class before her first class, \(15 < d \le 20\), and the class after her last class, \(45 < d \le 50\), have no conkers in them. Their midpoints are 17.5 and 47.5, so the polygon is joined down to a frequency of 0 at d = 17.5 and at d = 47.5.
Explanation
A frequency polygon can be open or closed. To close it, a frequency of 0 is plotted at the midpoint of the empty class on each side and joined to the first and last points. The points are still at class midpoints, so the ends are half a class width (2.5 mm) beyond 20 mm and 45 mm.
Mark scheme
-
1 mark
B1 for it is a closed frequency polygon: the classes either side of the data, \(15 < d \le 20\) and \(45 < d \le 50\), have a frequency of 0, and 17.5 and 47.5 are their midpoints oe
Accept 'no conkers were in the classes 15 to 20 mm or 45 to 50 mm, so a frequency of 0 is plotted at the midpoints of these classes' or 'the ends are joined to the axis half a class width beyond the first and last classes, where the frequency is 0'. The idea of a zero frequency for the next class (or for the classes either side) is needed. B0 for 'to close the shape' or 'because it is a closed polygon' alone; B0 for 'the smallest conker was 17.5 mm' or 'no conker had a diameter of 17.5 mm'.