
Level:
Correct: 0
Incorrect: 0
Marks: 0/0
Exam Practice
Course:
Topics:
Edexcel GCSE Statistics (Higher Paper 2) Smart practice A mixed round aimed at your weak spots
Unit 1
The statistical enquiry cycle
Statistical enquiry cycle stages 1 and 2; (a) Planning: 1a.01, 1a.02, 1a.03
Statistical enquiry cycle: planning and collecting
Statistical enquiry cycle stages 3, 4 and 5
Statistical enquiry cycle: interpreting and evaluating
Unit 2
The collection of data
(b) Types of data: 1b.01, 1b.02, 1b.03
Types of data and variables
(b) Types of data: 1b.04; (d) Collecting data: 1d.01, 1d.02
Primary and secondary data, reliability and validity
(c) Population and sampling: 1c.01, 1c.02, 1c.03
Populations, sampling frames and non-random sampling
(c) Population and sampling: 1c.04, 1c.05
Random and systematic sampling
(c) Population and sampling: 1c.06
Stratified sampling
(d) Collecting data: 1d.05, 1d.06
Problems with collected data and cleaning data
Unit 3
Processing, representing and analysing data
(a) Tabulation, diagrams and representation: 2a.01
Tabulation, tallies, pictograms and two-way tables
(a) Tabulation, diagrams and representation: 2a.01, 2a.02
Pie charts and comparative pie charts
(a) Tabulation, diagrams and representation: 2a.01
Stem and leaf diagrams
(a) Tabulation, diagrams and representation: 2a.02
Population pyramids, choropleth maps and 2D and 3D diagrams
(a) Tabulation, diagrams and representation: 2a.04
Histograms and frequency density
(a) Tabulation, diagrams and representation: 2a.05, 2a.06, 2a.07, 2a.08
Choosing representations and misleading diagrams
(a) Tabulation, diagrams and representation: 2a.09, 2a.10
Skewness
(b) Measures of central tendency: 2b.01, 2b.02, 2b.03
Mode, median and mean
(b) Measures of central tendency: 2b.01
Weighted mean and geometric mean
(c) Measures of dispersion: 2c.01, 2c.06
Standard deviation and standardised scores
(a) Tabulation, diagrams and representation: 2a.03; (c) Measures of dispersion: 2c.02, 2c.03
Box plots and outliers
(b) Measures of central tendency: 2b.03; (c) Measures of dispersion: 2c.04, 2c.05
Comparing distributions
(d) Further summary statistics: 2d.01
Index numbers
(d) Further summary statistics: 2d.02
Rates of change
(e) Scatter diagrams and correlation: 2e.01, 2e.02, 2e.03
Scatter diagrams, correlation and causation
(e) Scatter diagrams and correlation: 2e.04
Lines of best fit and regression lines
(e) Scatter diagrams and correlation: 2e.05, 2e.06, 2e.07, 2e.08
Spearman's rank and product moment correlation coefficients
(f) Time series: 2f.01, 2f.02; (b) 2b.01 mean seasonal variation
Time series, moving averages and seasonal variation
(g) Quality assurance: 2g.01, 2g.02
Quality assurance and control charts
(h) Estimation: 2h.01, 2h.02, 2h.03
Estimation, sample size and capture-recapture
Unit 4
Probability
3. Probability: 3p.01, 3p.02, 3p.03, 3p.04
Probability, expected frequency and risk
3. Probability: 3p.05, 3p.06, 3p.10
Experimental and theoretical probability and bias
3. Probability: 3p.11
Binomial distribution
3. Probability: 3p.12, 3p.13
Normal distribution
Avg
score:
–
Topics
done:
0/40

Statistical enquiry cycle: interpreting and evaluating

Practise 17 exam-style questions on Statistical enquiry cycle: interpreting and evaluating for Edexcel GCSE Statistics (Higher Paper 2). Write your answer as you would in the exam and get it marked in seconds against the mark scheme, point by point, with the Study Helper on hand if you get stuck.

  • 17 questions
  • 1–6 marks each
  • Instant marking
  • No sign-up needed
17 questions, marked as you go

Sample questions with model answers

Here are 4 of the questions in this topic, each with a model answer, an explanation of why it earns the marks and the mark scheme an examiner would use.

Question 1

1 mark

A theatre asked 140 people in its audience how they first heard about a new show.
The table shows the output from the theatre's spreadsheet.

The manager says that the spreadsheet must have made a mistake, because the percentages add up to 101.

Explain why the percentages add up to 101.
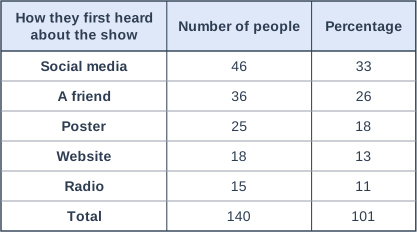
Table with columns "How they first heard about the show", "Number of people", "Percentage". How they first heard about the show: Social media; Number of people: 46; Percentage: 33 | How they first heard about the show: A friend; Number of people: 36; Percentage: 26 | How they first heard about the show: Poster; Number of people: 25; Percentage: 18 | How they first heard about the show: Website; Number of people: 18; Percentage: 13 | How they first heard about the show: Radio; Number of people: 15; Percentage: 11 | How they first heard about the show: Total; Number of people: 140; Percentage: 101.

Model answer

Each percentage has been rounded to the nearest whole number. For example, 46 out of 140 is 32.86%, shown as 33%. Several percentages were rounded up, so the rounded values add up to 101 even though the exact percentages add up to 100.

Explanation

When software rounds each percentage separately, the rounding errors can make the total 99 or 101. Here 32.86, 25.71, 17.86, 12.86 and 10.71 were all rounded up. The frequencies add up to 140, so no one has been counted twice; a note such as 'percentages may not add to 100 because of rounding' helps readers.

Mark scheme
  1. 1 mark

    B1 for each percentage has been rounded (to the nearest whole number), so the total of the rounded values can differ from 100

    oe, e.g. 'rounding errors: 46 out of 140 is 32.86%, which is shown as 33%'. Accept 'they are rounded, so they do not add up exactly'. B0 for 'someone was counted twice' or 'the spreadsheet is wrong' (the frequencies add up to 140).
Question 2

2 marks

Jodie's hypothesis is

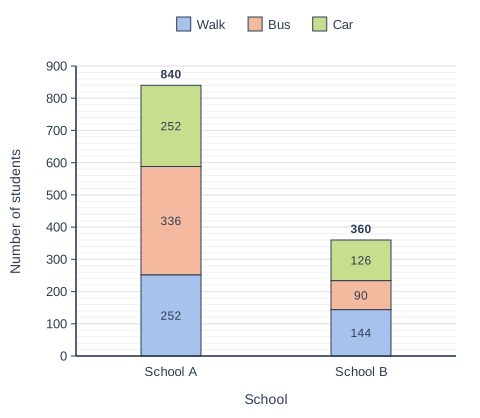
'A greater proportion of students walk to school at School B than at School A.'

School A has 840 students and School B has 360 students.
She used a spreadsheet to produce the composite bar chart shown.

Give one weakness of this chart for testing Jodie's hypothesis.
Suggest how the chart could be improved.

Stacked bar chart with 2 vertical bars. The value axis (y-axis) is "Number of students", from 0 to 900 marked every 100; the bars are labelled along the x-axis, "School", from left to right. Each bar is split into 3 parts, shown in the key: Walk (bottom, blue), Bus (middle, orange) and Car (top, green). Values: School A: walk 252, bus 336, car 252, total 840; School B: walk 144, bus 90, car 126, total 360. The value of each part is printed on it. Each bar's total is printed above it.

Model answer

The bars show numbers of students, but School A has 840 students and School B only 360, so a taller section does not mean a greater proportion. The chart cannot be used to compare proportions.
Jodie should use a percentage composite bar chart, where each bar is 100% of that school's students, so the proportions that walk can be compared directly.

Explanation

When groups of different sizes are compared, frequencies can mislead; proportions or percentages are needed. Here 252 out of 840 is 30% for School A and 144 out of 360 is 40% for School B, so School B has the greater proportion of walkers even though its walk section is shorter.

Mark scheme
  1. 1 mark

    B1 for the chart shows the numbers of students, but the schools have different numbers of students, so the heights of the sections do not show the proportions that walk (School A's walk section is taller only because School A is bigger)

    oe. The answer must refer to frequencies (numbers) and the different sizes of the schools, or say that the chart does not show proportions. B0 for weaknesses that are not true of this chart, e.g. 'it has no key' or 'the axis does not start at 0'.

  2. 1 mark

    B1 for a percentage (proportional) composite bar chart, with each bar showing 100% of a school's students

    oe. Accept 'show the percentage of each school that walks, goes by bus and goes by car' or 'use a comparative pie chart for each school'. B0 for 'use a pie chart' (one pie chart) or 'use a line graph'. This mark is independent of the first mark.

Question 3

3 marks

Marta, a French teacher, tested the hypothesis

'Students remember more new words when they learn them with flashcards than when they learn them from a printed list.'

Her own Year 9 class of 28 students learned 30 new French words using flashcards. Another teacher's Year 9 class of 27 students learned the same 30 words from a printed list. A week later, every student was tested on the 30 words.

Flashcards: median 22 words
Printed list: median 17 words

Marta concludes that using flashcards helps students to remember more words.

Explain why Marta's results do not show that the flashcards caused the difference.
Describe how Marta could refine her investigation, giving a reason.

Model answer

The two groups were different classes with different teachers, so they may differ in ability or in how they were taught. The higher median for the flashcard group could be due to these differences rather than to the flashcards.
Marta could take both classes and put half of the students from each class into each group at random. Then the two groups would be similar in ability, so a difference in the results would more likely be due to the method of learning.

Explanation

To show that one method causes better results, the groups must differ only in the method. Comparing two existing classes mixes up the method with the class, the teacher and the students' ability. Refining the design with random allocation, matched pairs or the same students using both methods removes these other explanations.

Mark scheme
  1. 1 mark

    B1 for the two groups differ in other ways as well as the method of learning (e.g. the classes may differ in ability, they had different teachers, or they learned or were tested at different times), so the difference could be due to these other factors, not the flashcards

    oe. Any one difference between the groups, linked to it being a possible cause of the difference in the results. Accept 'the classes were not chosen at random, so they may not be similar'. B0 for 'the samples are small' or 'some students may have guessed' with no link to differences between the groups. B0 for 'the flashcard group did better, so the hypothesis is supported'.

  2. 2 marks

    B2 for a suitable refinement with a valid reason (B1 for a suitable refinement without a valid reason)

    Refinements and reasons include: (1) put the students from both classes into the two groups at random (e.g. half of each class uses each method), so the two groups are similar in ability; (2) use the same students for both methods, learning one set of words with flashcards and a similar set from a printed list, in a random order, so differences between students cannot affect the comparison; (3) give a vocabulary test first and pair students of similar ability, one of each pair in each group (matched pairs), so the groups are similar; (4) use the same teacher, the same time allowed and the same test conditions for both groups, so only the method of learning changes; (5) use larger groups chosen at random from the whole year group, so the results are more reliable. B0 for 'test more often' or 'collect more data' with no detail. This mark is independent of the first mark.

Question 4

4 marks

A software company has made a new version of its navigation app. Its hypothesis is

'The new version of the app uses less battery than the old version.'

Eight members of staff from the company's office each used the old version for one day and then the new version on the next day.
The mean percentage of battery used in a day was 31% with the old version and 27% with the new version.

The company's website says, 'Our new app uses less battery for every user.'

Discuss the reliability of the company's statement.

Model answer

The statement is not reliable.
- Only 8 people were tested, so a different sample could easily give a different result.
- They were office staff, not a random sample of users, so they may not be representative and may want the new app to do well.
- Each version was used on a different day, and phone use may have been different on the two days, so the difference may not be due to the app.
- A lower mean (27% compared with 31%) does not show that every user used less battery; some of the 8 may have used more.

Explanation

When discussing reliability, consider the sample (size and how it was chosen), how the data were collected (fair comparison, other variables) and whether the conclusion claims more than the data show. A mean comparison can never support a claim about 'every user'. Credit is also available for a strength, such as each person testing both versions.

Mark scheme
  1. 1 mark

    B1 for the sample is small (only 8 people), so the results may not be reliable / a different sample could give a different result

    B1 for each correct comment, max 4. Each comment must give a reason linked to this test. A judgement (reliable or not reliable) with no reason scores B0.

  2. 1 mark

    B1 for the people were office staff, not a random sample of the app's users, so they may not be representative (e.g. similar phones or similar journeys)

    oe.

  3. 1 mark

    B1 for the staff work for the company and may want the new version to do well (e.g. they may use their phones less on the second day), so the results may be biased

    oe.

  4. 1 mark

    B1 for each version was used on a different day, and people may have used their phones differently on the two days (e.g. longer journeys), so the difference may be due to the day, not the app

    oe. Accept 'the new version was always used second, so it was not a fair comparison'.

  5. 1 mark

    B1 for each person used both versions, which is a strength, because differences between people and their phones are controlled

    oe.

  6. 1 mark

    B1 for a mean difference of 4 percentage points is small and we do not know how much the results varied, so the difference could be due to chance

    oe.

  7. 1 mark

    B1 for a lower mean does not show that every user used less battery (some of the 8 may have used more), so 'for every user' is not supported / the result may not apply to other phones or users

    oe. Ignore extraneous non-contradictory comments.

Ready to try the rest? Every answer you write is marked against the mark scheme, so you can see exactly where the marks are.

Study Helper Hints first, answers after you try

Stuck on this one? Ask for a hint and I’ll point you in the right direction, without giving the answer away. Once you’ve checked your answer, I’ll show you how the marks are awarded.