Level:
Correct: 0
Incorrect: 0
Marks: 0/0
Exam Practice
Course:
Topics:
Edexcel GCSE Statistics (Higher Paper 2) Smart practice A mixed round aimed at your weak spots
Unit 1
The statistical enquiry cycle
Statistical enquiry cycle stages 1 and 2; (a) Planning: 1a.01, 1a.02, 1a.03
Statistical enquiry cycle: planning and collecting
Statistical enquiry cycle stages 3, 4 and 5
Statistical enquiry cycle: interpreting and evaluating
Unit 2
The collection of data
(b) Types of data: 1b.01, 1b.02, 1b.03
Types of data and variables
(b) Types of data: 1b.04; (d) Collecting data: 1d.01, 1d.02
Primary and secondary data, reliability and validity
(c) Population and sampling: 1c.01, 1c.02, 1c.03
Populations, sampling frames and non-random sampling
(c) Population and sampling: 1c.04, 1c.05
Random and systematic sampling
(c) Population and sampling: 1c.06
Stratified sampling
(d) Collecting data: 1d.05, 1d.06
Problems with collected data and cleaning data
Unit 3
Processing, representing and analysing data
(a) Tabulation, diagrams and representation: 2a.01
Tabulation, tallies, pictograms and two-way tables
(a) Tabulation, diagrams and representation: 2a.01, 2a.02
Pie charts and comparative pie charts
(a) Tabulation, diagrams and representation: 2a.01
Stem and leaf diagrams
(a) Tabulation, diagrams and representation: 2a.02
Population pyramids, choropleth maps and 2D and 3D diagrams
(a) Tabulation, diagrams and representation: 2a.04
Histograms and frequency density
(a) Tabulation, diagrams and representation: 2a.05, 2a.06, 2a.07, 2a.08
Choosing representations and misleading diagrams
(a) Tabulation, diagrams and representation: 2a.09, 2a.10
Skewness
(b) Measures of central tendency: 2b.01, 2b.02, 2b.03
Mode, median and mean
(b) Measures of central tendency: 2b.01
Weighted mean and geometric mean
(c) Measures of dispersion: 2c.01, 2c.06
Standard deviation and standardised scores
(a) Tabulation, diagrams and representation: 2a.03; (c) Measures of dispersion: 2c.02, 2c.03
Box plots and outliers
(b) Measures of central tendency: 2b.03; (c) Measures of dispersion: 2c.04, 2c.05
Comparing distributions
(d) Further summary statistics: 2d.01
Index numbers
(d) Further summary statistics: 2d.02
Rates of change
(e) Scatter diagrams and correlation: 2e.01, 2e.02, 2e.03
Scatter diagrams, correlation and causation
(e) Scatter diagrams and correlation: 2e.04
Lines of best fit and regression lines
(e) Scatter diagrams and correlation: 2e.05, 2e.06, 2e.07, 2e.08
Spearman's rank and product moment correlation coefficients
(f) Time series: 2f.01, 2f.02; (b) 2b.01 mean seasonal variation
Time series, moving averages and seasonal variation
(g) Quality assurance: 2g.01, 2g.02
Quality assurance and control charts
(h) Estimation: 2h.01, 2h.02, 2h.03
Estimation, sample size and capture-recapture
Unit 4
Probability
3. Probability: 3p.01, 3p.02, 3p.03, 3p.04
Probability, expected frequency and risk
3. Probability: 3p.05, 3p.06, 3p.10
Experimental and theoretical probability and bias
3. Probability: 3p.11
Binomial distribution
3. Probability: 3p.12, 3p.13
Normal distribution
Avg
score:
–
Topics
done:
0/40

Population pyramids, choropleth maps and 2D and 3D diagrams

Practise 13 exam-style questions on Population pyramids, choropleth maps and 2D and 3D diagrams for Edexcel GCSE Statistics (Higher Paper 2). Write your answer as you would in the exam and get it marked in seconds against the mark scheme, point by point, with the Study Helper on hand if you get stuck.

  • 13 questions
  • 1–5 marks each
  • Instant marking
  • No sign-up needed
13 questions, marked as you go

Sample questions with model answers

Here are 4 of the questions in this topic, each with a model answer, an explanation of why it earns the marks and the mark scheme an examiner would use.

Question 1

1 mark

The population pyramid shows the percentage of the population of Island J in each age group, for males and for females.

Nadia says, "On Island J, women tend to live longer than men."

Give one feature of the population pyramid that supports Nadia's statement.
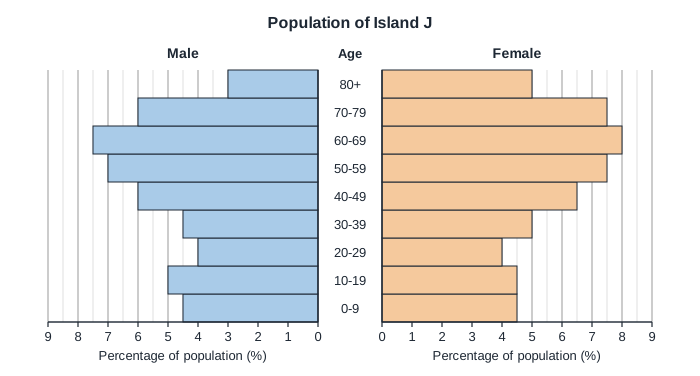
Population pyramid titled 'Population of Island J'. Male bars go to the left and female bars to the right of a central column of age groups, with the youngest at the bottom: 0-9, 10-19, 20-29, 30-39, 40-49, 50-59, 60-69, 70-79, 80+. Each side has a horizontal scale labelled 'Percentage of population (%)', numbered 0 to 9 from the centre outwards, with grid lines every 0.5. Every bar ends exactly on a grid line. Male bars from 0-9 up to 80+: 4.5, 5, 4, 4.5, 6, 7, 7.5, 6, 3. Female bars from 0-9 up to 80+: 4.5, 4.5, 4, 5, 6.5, 7.5, 8, 7.5, 5.

Model answer

The female bars are longer than the male bars in the oldest age groups: 7.5% of the population are women aged 70-79 compared with 6% men, and 5% are women aged 80 and over compared with only 3% men. So more women than men survive to old age.

Explanation

Life expectancy shows at the top of a population pyramid: if women tend to live longer than men, the female bars for the oldest age groups are longer than the male bars, even where the bars for younger people are about the same. A feature must compare the two sides in the older age groups; the total numbers of males and females on their own do not show this.

Mark scheme
  1. 1 mark

    B1 for a correct comparison of the female and male bars for the oldest age groups, eg the female bars are longer than the male bars for 70-79 and 80+ / there is a greater percentage of women than men aged 80 and over (5% compared with 3%)

    oe, eg 'at the top of the pyramid the female side is wider', '12.5% of the population are women aged 70 or over, but only 9% are men aged 70 or over', 'the 70-79 female bar is 7.5% but the male bar is 6%'. Values are not required. A comparison that also includes 60-69 (8% compared with 7.5%) is fine. B0 for 'there are more females than males' with no reference to the older age groups. B0 for a statement about one side only, eg 'there are a lot of old women', or for comments about the younger age groups.
Question 2

2 marks

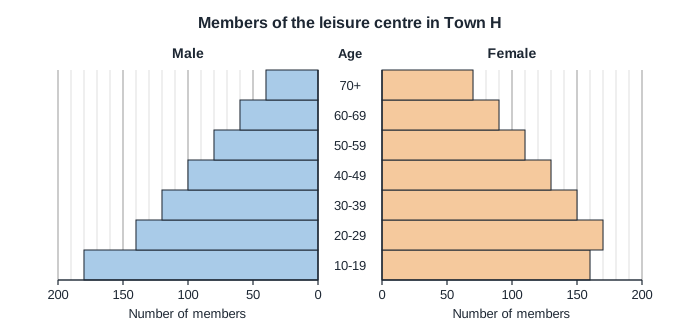
The population pyramid shows the age and sex of the members of the leisure centre in Town H.

Lily says, "The pyramid shows that more females than males live in Town H."

Explain why Lily may be wrong.

Give one comparison of the ages of the male members and the female members.

Population pyramid titled 'Members of the leisure centre in Town H'. Male bars go to the left and female bars to the right of a central column of age groups, with the youngest at the bottom: 10-19, 20-29, 30-39, 40-49, 50-59, 60-69, 70+. Each side has a horizontal scale labelled 'Number of members', numbered 0, 50, 100, 150, 200 from the centre outwards, with grid lines every 10. Every bar ends exactly on a grid line. Male bars from 10-19 up to 70+: 180, 140, 120, 100, 80, 60, 40. Female bars from 10-19 up to 70+: 160, 170, 150, 130, 110, 90, 70.

Model answer

The pyramid shows only the people who are members of the leisure centre. Many people in Town H are not members, and females may simply be more likely than males to join, so it does not show how many males and females live in the town.

Comparison: the largest group of male members is aged 10-19 (180), but the largest group of female members is aged 20-29 (170). In every age group from 20-29 upwards there are more female members than male members.

Explanation

Always check what population a diagram describes: this pyramid is of leisure centre members, a small and possibly unrepresentative part of the town, so it cannot support a claim about all residents. Comparisons of the two sides should be about the shape of the distributions of age, for example which age group is largest for each sex.

Mark scheme
  1. 1 mark

    B1 for the pyramid shows only the members of the leisure centre, not everyone who lives in Town H oe

    oe, eg 'not everyone in the town is a member', 'females may be more likely to join the centre', 'some members may live outside the town'. B0 for 'the pyramid is not accurate' or 'it only shows people aged 10 and over' with no further explanation.

  2. 1 mark

    B1 for a correct comparison of the ages, eg there are more female members than male members in every age group from 20-29 upwards / the largest male age group is 10-19 but the largest female age group is 20-29 / a greater proportion of the male members are aged 10-19

    Also accept: the number of male members falls with every older age group (from 180 to 40), while the female numbers rise from 10-19 to 20-29 and then fall; there are more male than female members aged 10-19 (180 compared with 160). The comparison must use comparative language and be about age (not just the total numbers of males and females, 720 and 880). Values are not required. Ignore extraneous non-contradictory comments.

Question 3

3 marks

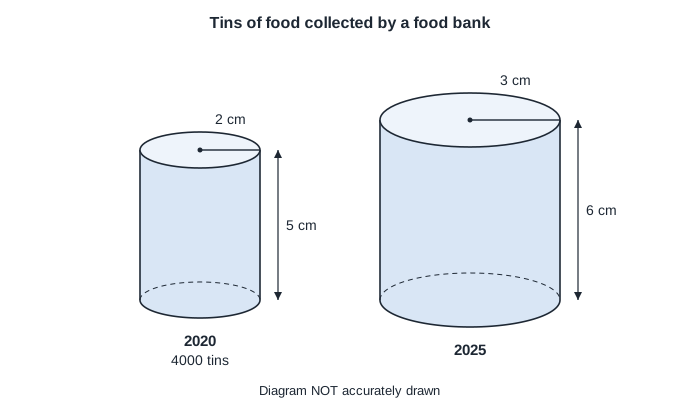
A food bank's poster shows the number of tins of food it collected in 2020 and in 2025 as pictures of two tins. The volume of each tin in the picture is proportional to the number of tins of food collected.

The diagram shows the two tins, with their radii and heights.

The food bank collected 4000 tins of food in 2020.

Work out the number of tins of food it collected in 2025.

Diagram titled 'Tins of food collected by a food bank', marked 'Diagram NOT accurately drawn'. Two cylinders (tins) stand side by side. The left tin is labelled 2020 and '4000 tins'; its radius is marked 2 cm on its top face and its height is marked 5 cm. The right tin is labelled 2025, with no number of tins; its radius is marked 3 cm on its top face and its height is marked 6 cm.

Model answer

Volume of the 2020 tin \(= \pi \times 2^2 \times 5 = 20\pi\) cm\(^3\)
Volume of the 2025 tin \(= \pi \times 3^2 \times 6 = 54\pi\) cm\(^3\)
Volume scale factor \(= \dfrac{54\pi}{20\pi} = 2.7\)
Number of tins in 2025 \(= 4000 \times 2.7 = 10\,800\)

Answer: 10 800 tins

Explanation

The volume of a cylinder is \(\pi r^2 h\). Here the radius grows by a factor of 1.5 but the height only by 1.2, so the tins are not similar shapes and there is no single length scale factor to cube: work out both volumes (or \(1.5^2 \times 1.2 = 2.7\)). Comparing only the radii or only the heights ignores the other dimensions of the picture.

Mark scheme
  1. 1 mark

    M1 for \(\pi \times 2^2 \times 5\) (= 62.8...) or \(\pi \times 3^2 \times 6\) (= 169.6...) oe

    oe, eg \(20\pi\) or \(54\pi\), or \(2^2 \times 5 = 20\) and \(3^2 \times 6 = 54\) (\(\pi\) cancels), or the scale factors \(1.5^2\) and 1.2 seen. Answer-only rule for this question: Correct answer with no working scores 3 marks.

  2. 1 mark

    M1 for \(4000 \times \dfrac{3^2 \times 6}{2^2 \times 5}\) oe

    oe, eg \(4000 \times \dfrac{54\pi}{20\pi}\), \(4000 \times 2.7\), \(4000 \times 1.5^2 \times 1.2\). Using a radius or height ratio alone (6000 or 4800), \(1.5^3\) (13 500) or \(\dfrac{3^2}{2^2}\) only (9000) scores M0A0.

  3. 1 mark

    A1 for 10 800

    cao. Correct answer with no working scores 3 marks.

Question 4

4 marks

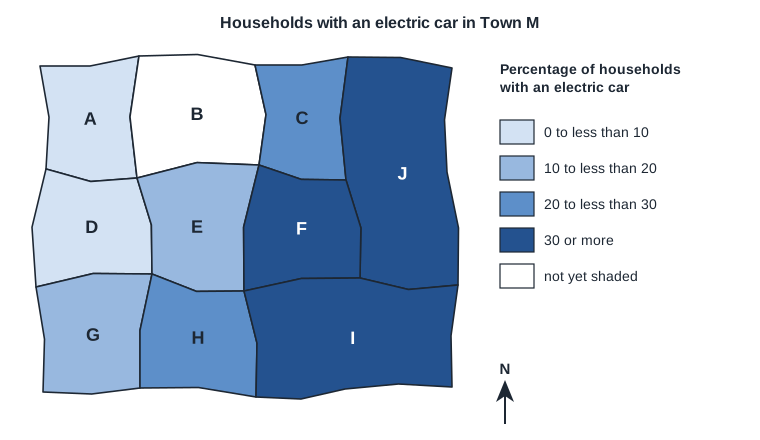
The choropleth map shows the percentage of households with an electric car in each ward of Town M. Ward B has not been shaded yet.

Ward B has 3000 households. 40% of these households have a driveway, and 35% of the households with a driveway have an electric car.

The council knows that Ward B belongs in the class '20 to less than 30'.

Work out the least possible percentage of the households without a driveway in Ward B that have an electric car.
You must show your working.

Choropleth map titled 'Households with an electric car in Town M', with a north arrow pointing up the page. The town is divided into 10 wards labelled A to J, in roughly three rows from north to south. North row, from west to east: A, B, C, then J (J is in the east and stretches down into the middle row). Middle row, from west to east: D, E, F, then J. South row, from west to east: G, H, then I (a wide ward in the south-east). Key, 'Percentage of households with an electric car', from lightest to darkest shade: 0 to less than 10; 10 to less than 20; 20 to less than 30; 30 or more; a white box means not yet shaded. Ward shading: A 0 to less than 10; B white (not yet shaded); C 20 to less than 30; D 0 to less than 10; E 10 to less than 20; F 30 or more; G 10 to less than 20; H 20 to less than 30; I 30 or more; J 30 or more.

Model answer

Households with a driveway: \(0.4 \times 3000 = 1200\), and \(0.35 \times 1200 = 420\) of these have an electric car.
Ward B is in the class '20 to less than 30', so at least 20% of its households have an electric car: at least \(0.2 \times 3000 = 600\) households.
So at least 600 - 420 = 180 of the 3000 - 1200 = 1800 households without a driveway have an electric car.
Least possible percentage \(= \dfrac{180}{1800} \times 100 = 10\%\)

Answer: 10%

Explanation

Work with numbers of households, because 35% and the unknown percentage are percentages of different-sized groups. The class '20 to less than 30' includes 20%, so the least possible total is exactly 20% of the ward's households; take away the households with a driveway and an electric car, then divide by the 1800 households without a driveway, not by all 3000.

Mark scheme
  1. 1 mark

    M1 for \(0.35 \times 0.4 \times 3000\) (= 420) oe

    The households with a driveway and an electric car. oe, eg \(0.4 \times 3000 = 1200\) then \(0.35 \times 1200\), or \(0.4 \times 0.35 = 0.14\) (14% of all the households). May be seen in a two-way table or frequency tree.

  2. 1 mark

    M1 for \(0.2 \times 3000\) (= 600) oe

    The least number of households in Ward B with an electric car. oe, eg 20% used as the least percentage for the ward, as in 20 - 14 = 6 (% of all the households).

  3. 1 mark

    M1 for \(\dfrac{\text{their } 600 - \text{their } 420}{3000 - 1200}\) (\(\times 100\)) oe

    oe, eg \(\dfrac{180}{1800}\), \(\dfrac{6}{60}\), or solving \(0.14 + 0.6p = 0.2\). ft their values. Dividing by 3000 instead of 1800 (giving 6%) scores M1M1M0A0.

  4. 1 mark

    A1 for 10(%)

    cao. Answer only scores 0: the question says you must show your working. 'Just over 10%' or 10.06% (from 181 households, treating 20% as not in the class) scores M1M1M1A0: the class '20 to less than 30' includes 20%, so exactly 10% is possible.

Ready to try the rest? Every answer you write is marked against the mark scheme, so you can see exactly where the marks are.

Study Helper Hints first, answers after you try

Stuck on this one? Ask for a hint and I’ll point you in the right direction, without giving the answer away. Once you’ve checked your answer, I’ll show you how the marks are awarded.