Level:
Correct: 0
Incorrect: 0
Marks: 0/0
Exam Practice
Course:
Topics:
Edexcel GCSE Statistics (Higher Paper 2) Smart practice A mixed round aimed at your weak spots
Unit 1
The statistical enquiry cycle
Statistical enquiry cycle stages 1 and 2; (a) Planning: 1a.01, 1a.02, 1a.03
Statistical enquiry cycle: planning and collecting
Statistical enquiry cycle stages 3, 4 and 5
Statistical enquiry cycle: interpreting and evaluating
Unit 2
The collection of data
(b) Types of data: 1b.01, 1b.02, 1b.03
Types of data and variables
(b) Types of data: 1b.04; (d) Collecting data: 1d.01, 1d.02
Primary and secondary data, reliability and validity
(c) Population and sampling: 1c.01, 1c.02, 1c.03
Populations, sampling frames and non-random sampling
(c) Population and sampling: 1c.04, 1c.05
Random and systematic sampling
(c) Population and sampling: 1c.06
Stratified sampling
(d) Collecting data: 1d.05, 1d.06
Problems with collected data and cleaning data
Unit 3
Processing, representing and analysing data
(a) Tabulation, diagrams and representation: 2a.01
Tabulation, tallies, pictograms and two-way tables
(a) Tabulation, diagrams and representation: 2a.01, 2a.02
Pie charts and comparative pie charts
(a) Tabulation, diagrams and representation: 2a.01
Stem and leaf diagrams
(a) Tabulation, diagrams and representation: 2a.02
Population pyramids, choropleth maps and 2D and 3D diagrams
(a) Tabulation, diagrams and representation: 2a.04
Histograms and frequency density
(a) Tabulation, diagrams and representation: 2a.05, 2a.06, 2a.07, 2a.08
Choosing representations and misleading diagrams
(a) Tabulation, diagrams and representation: 2a.09, 2a.10
Skewness
(b) Measures of central tendency: 2b.01, 2b.02, 2b.03
Mode, median and mean
(b) Measures of central tendency: 2b.01
Weighted mean and geometric mean
(c) Measures of dispersion: 2c.01, 2c.06
Standard deviation and standardised scores
(a) Tabulation, diagrams and representation: 2a.03; (c) Measures of dispersion: 2c.02, 2c.03
Box plots and outliers
(b) Measures of central tendency: 2b.03; (c) Measures of dispersion: 2c.04, 2c.05
Comparing distributions
(d) Further summary statistics: 2d.01
Index numbers
(d) Further summary statistics: 2d.02
Rates of change
(e) Scatter diagrams and correlation: 2e.01, 2e.02, 2e.03
Scatter diagrams, correlation and causation
(e) Scatter diagrams and correlation: 2e.04
Lines of best fit and regression lines
(e) Scatter diagrams and correlation: 2e.05, 2e.06, 2e.07, 2e.08
Spearman's rank and product moment correlation coefficients
(f) Time series: 2f.01, 2f.02; (b) 2b.01 mean seasonal variation
Time series, moving averages and seasonal variation
(g) Quality assurance: 2g.01, 2g.02
Quality assurance and control charts
(h) Estimation: 2h.01, 2h.02, 2h.03
Estimation, sample size and capture-recapture
Unit 4
Probability
3. Probability: 3p.01, 3p.02, 3p.03, 3p.04
Probability, expected frequency and risk
3. Probability: 3p.05, 3p.06, 3p.10
Experimental and theoretical probability and bias
3. Probability: 3p.11
Binomial distribution
3. Probability: 3p.12, 3p.13
Normal distribution
Avg
score:
–
Topics
done:
0/40

Tabulation, tallies, pictograms and two-way tables

Practise 13 exam-style questions on Tabulation, tallies, pictograms and two-way tables for Edexcel GCSE Statistics (Higher Paper 2). Write your answer as you would in the exam and get it marked in seconds against the mark scheme, point by point, with the Study Helper on hand if you get stuck.

  • 13 questions
  • 1–5 marks each
  • Instant marking
  • No sign-up needed
13 questions, marked as you go

Sample questions with model answers

Here are 4 of the questions in this topic, each with a model answer, an explanation of why it earns the marks and the mark scheme an examiner would use.

Question 1

1 mark

A school nurse records the reason for each visit that a student makes to the medical room: headache, injury, feeling sick or other. She records the visits for each week in a tally chart.

Give one disadvantage of recording the visits in a tally chart, rather than writing down each visit in a list as it happens.

Model answer

A tally chart records only how many visits there were for each reason: each visit is just one mark in a row. The order and the times of the visits are lost, so the nurse could not tell, for example, whether most headaches happen in the afternoon, or whether the same student visited several times.

Explanation

A tally chart is quick to fill in and gives the frequency of each category straight away, but it keeps nothing else about each item. A list written as the visits happen keeps their order (and anything else noted, such as the time or the student), so the data can be looked at in other ways later. An answer must say what information is lost: 'it is less accurate' or 'it is harder' does not score.

Mark scheme
  1. 1 mark

    B1 for a correct disadvantage: information about the individual visits is lost, eg the order or the times of the visits are not recorded / the nurse cannot tell which day each visit happened / she cannot tell whether the same student made several visits

    oe, eg 'you can't see when the headaches happened', 'the tally chart only shows how many visits there were for each reason', 'the visits can't be sorted in another way later, eg by year group'. B0 for vague answers with no reason, eg 'it is less accurate', 'it is harder to read', 'it takes longer', 'it is easy to make mistakes'. B0 for 'you cannot find the totals' (the tally chart gives the frequency of each reason). Ignore extraneous non-contradictory comments.
Question 2

2 marks

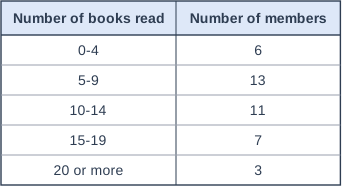
A reading club recorded the number of books that each of its 40 members read last year. The table shows the results.

Kemi says, "There are gaps between the classes, so some members' results might not fit in the table."

Explain whether Kemi is correct.

Give one disadvantage of using the class '20 or more'.

Table with columns "Number of books read", "Number of members". Number of books read: 0-4; Number of members: 6 | Number of books read: 5-9; Number of members: 13 | Number of books read: 10-14; Number of members: 11 | Number of books read: 15-19; Number of members: 7 | Number of books read: 20 or more; Number of members: 3.

Model answer

Kemi is not correct. The number of books read is discrete: it is always a whole number, so no member can have a result between 4 and 5 (or between 9 and 10, and so on). Every possible number of books fits exactly one class.

Disadvantage: the class '20 or more' has no upper limit, so we do not know the largest number of books read. The range cannot be found, and the class has no midpoint for working out an estimate of the mean.

Explanation

For discrete data, classes such as 0-4 and 5-9 leave no real gaps, because there are no values between 4 and 5; gaps matter for continuous data such as lengths or times, where classes are written with inequalities. An open-ended class like '20 or more' makes sure every value has a class, but because it has no upper boundary the largest value, the range and a midpoint for an estimated mean are unknown.

Mark scheme
  1. 1 mark

    B1 for Kemi is not correct, as the number of books is discrete (always a whole number), so there are no values between the classes and every result fits exactly one class oe

    Must include a decision (not correct / no) and a reason that refers to the data being discrete or whole numbers, eg 'No, nobody can have read 4.5 books, so nothing falls between 4 and 5'. Condone 'counted data' for discrete. 'No, the classes are fine' with no reason scores B0. 'Yes' scores B0.

  2. 1 mark

    B1 for a correct disadvantage of the open-ended class, eg the largest number of books read is not known / the range cannot be found / the class has no upper boundary (or midpoint), so an estimate of the mean cannot be worked out

    oe, eg 'we don't know how many books those 3 members read - it could be 20 or 100', 'the class has no end, so its width is unknown'. B0 for 'the class is too big', 'it is not specific' or 'it is not accurate' with no further explanation. 'We don't know the exact values' scores B0 unless it is linked to the missing upper limit (it is true of every class).

Question 3

3 marks

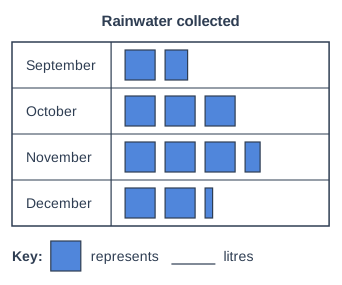
A school garden collects rainwater in a large water butt. The pictogram shows the amount of rainwater collected in each of four months. The key does not show how many litres one square represents.

In December, 90 litres of rainwater were collected.

Work out the mean amount of rainwater collected per month for these four months.

Pictogram titled "Rainwater collected", a table with 4 rows of square symbols. Key: one square represents a number of litres that is left blank. September: 1 and three quarters squares. October: 3 squares. November: 3 and a half squares. December: 2 and a quarter squares.

Model answer

December: \(2\dfrac{1}{4}\) squares = 90 litres, so 1 square = \(90 \div 2.25 = 40\) litres
September: \(1\dfrac{3}{4} \times 40 = 70\) litres
October: \(3 \times 40 = 120\) litres
November: \(3\dfrac{1}{2} \times 40 = 140\) litres
Total = 70 + 120 + 140 + 90 = 420 litres
Mean = \(420 \div 4 = 105\) litres

Answer: 105 litres

Explanation

First find the key from the row you know: 90 litres is shown by \(2\dfrac{1}{4}\) squares, so each square is 40 litres. Then convert every row (or find the mean number of squares, \(10.5 \div 4 = 2.625\), and multiply by 40). The mean per month is the total divided by the 4 months, not by the number of squares.

Mark scheme
  1. 1 mark

    M1 for \(90 \div 2.25\) (= 40) oe

    December is \(2\dfrac{1}{4}\) squares, so one square represents 40 litres. Implied by a correct amount for another month (70, 120 or 140 litres).

  2. 1 mark

    M1 for (their 70 + their 120 + their 140 + 90) \(\div\) 4 oe

    oe, eg \(10.5 \times\) their 40 \(\div\) 4, or the mean number of squares \(2.625 \times\) their 40. Squares: September \(1\dfrac{3}{4}\), October 3, November \(3\dfrac{1}{2}\), December \(2\dfrac{1}{4}\) (10.5 altogether). ft their key.

  3. 1 mark

    A1 for 105 (litres)

    cao. 420 (the total) with no division by 4 scores M1M0A0. Dividing by the number of squares instead of the number of months scores M1M0A0. Correct answer with no working scores 3 marks.

Question 4

4 marks

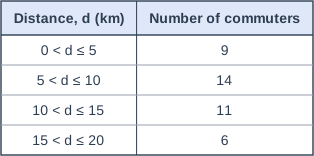
Asif asked 40 commuters who cycle to work how far they cycle each day. The table shows his results.

Work out the least possible number and the greatest possible number of these commuters who cycle more than 8 km.

Asif assumes that the distances in the class \(5 < d \le 10\) are spread evenly through the class. Use his assumption to estimate the number of these commuters who cycle more than 8 km.

Table with columns "Distance, d (km)", "Number of commuters". Distance, d (km): 0 < d ≤ 5; Number of commuters: 9 | Distance, d (km): 5 < d ≤ 10; Number of commuters: 14 | Distance, d (km): 10 < d ≤ 15; Number of commuters: 11 | Distance, d (km): 15 < d ≤ 20; Number of commuters: 6.

Model answer

Least: none of the 14 commuters in \(5 < d \le 10\) cycles more than 8 km, so 11 + 6 = 17
Greatest: all 14 of them cycle more than 8 km, so 14 + 11 + 6 = 31

Estimate: from 8 km to 10 km is 2 km of the 5 km class width, so about \(\dfrac{2}{5} \times 14 = 5.6\) commuters in this class cycle more than 8 km.
Estimate = 17 + 5.6 = 22.6, so about 23 commuters.

Explanation

8 km is inside the class \(5 < d \le 10\), so the table gives only bounds: the 14 commuters in that class could all cycle 8 km or less, or all cycle more. If the values are spread evenly through the class (linear interpolation), the part of the class above 8 km is \(\dfrac{10 - 8}{5} = \dfrac{2}{5}\) of its width, so about \(\dfrac{2}{5}\) of its 14 commuters. A common error is to use the part from 5 km to 8 km instead.

Mark scheme
  1. 1 mark

    B1 for least possible number 17

    11 + 6: all 14 commuters in \(5 < d \le 10\) could cycle 8 km or less. Answer-only rule for this question: Correct answer with no working scores the M1A1.

  2. 1 mark

    B1 for greatest possible number 31

    14 + 11 + 6: all 14 commuters in \(5 < d \le 10\) could cycle more than 8 km. 40, or 23 (9 + 14), scores B0. Each of these two marks is independent.

  3. 1 mark

    M1 for \(\dfrac{2}{5} \times 14\) (= 5.6) oe

    oe, eg \(\dfrac{10 - 8}{10 - 5} \times 14\), or 14 - \(\dfrac{3}{5} \times 14\) (= 14 - 8.4). Using \(\dfrac{3}{5} \times 14\) (= 8.4) as the number above 8 km scores M0.

  4. 1 mark

    A1 for 22.6 or 23 or 22

    17 + 5.6 = 22.6; accept 22.6, 23 or 22 (rounded or truncated). 25.4 (17 + 8.4) scores M0A0. Correct answer with no working scores the M1A1.

Ready to try the rest? Every answer you write is marked against the mark scheme, so you can see exactly where the marks are.

Study Helper Hints first, answers after you try

Stuck on this one? Ask for a hint and I’ll point you in the right direction, without giving the answer away. Once you’ve checked your answer, I’ll show you how the marks are awarded.