
Level:
Correct: 0
Incorrect: 0
Marks: 0/0
Exam Practice
Course:
Topics:
Edexcel GCSE Statistics (Higher Paper 2) Smart practice A mixed round aimed at your weak spots
Unit 1
The statistical enquiry cycle
Statistical enquiry cycle stages 1 and 2; (a) Planning: 1a.01, 1a.02, 1a.03
Statistical enquiry cycle: planning and collecting
Statistical enquiry cycle stages 3, 4 and 5
Statistical enquiry cycle: interpreting and evaluating
Unit 2
The collection of data
(b) Types of data: 1b.01, 1b.02, 1b.03
Types of data and variables
(b) Types of data: 1b.04; (d) Collecting data: 1d.01, 1d.02
Primary and secondary data, reliability and validity
(c) Population and sampling: 1c.01, 1c.02, 1c.03
Populations, sampling frames and non-random sampling
(c) Population and sampling: 1c.04, 1c.05
Random and systematic sampling
(c) Population and sampling: 1c.06
Stratified sampling
(d) Collecting data: 1d.05, 1d.06
Problems with collected data and cleaning data
Unit 3
Processing, representing and analysing data
(a) Tabulation, diagrams and representation: 2a.01
Tabulation, tallies, pictograms and two-way tables
(a) Tabulation, diagrams and representation: 2a.01, 2a.02
Pie charts and comparative pie charts
(a) Tabulation, diagrams and representation: 2a.01
Stem and leaf diagrams
(a) Tabulation, diagrams and representation: 2a.02
Population pyramids, choropleth maps and 2D and 3D diagrams
(a) Tabulation, diagrams and representation: 2a.04
Histograms and frequency density
(a) Tabulation, diagrams and representation: 2a.05, 2a.06, 2a.07, 2a.08
Choosing representations and misleading diagrams
(a) Tabulation, diagrams and representation: 2a.09, 2a.10
Skewness
(b) Measures of central tendency: 2b.01, 2b.02, 2b.03
Mode, median and mean
(b) Measures of central tendency: 2b.01
Weighted mean and geometric mean
(c) Measures of dispersion: 2c.01, 2c.06
Standard deviation and standardised scores
(a) Tabulation, diagrams and representation: 2a.03; (c) Measures of dispersion: 2c.02, 2c.03
Box plots and outliers
(b) Measures of central tendency: 2b.03; (c) Measures of dispersion: 2c.04, 2c.05
Comparing distributions
(d) Further summary statistics: 2d.01
Index numbers
(d) Further summary statistics: 2d.02
Rates of change
(e) Scatter diagrams and correlation: 2e.01, 2e.02, 2e.03
Scatter diagrams, correlation and causation
(e) Scatter diagrams and correlation: 2e.04
Lines of best fit and regression lines
(e) Scatter diagrams and correlation: 2e.05, 2e.06, 2e.07, 2e.08
Spearman's rank and product moment correlation coefficients
(f) Time series: 2f.01, 2f.02; (b) 2b.01 mean seasonal variation
Time series, moving averages and seasonal variation
(g) Quality assurance: 2g.01, 2g.02
Quality assurance and control charts
(h) Estimation: 2h.01, 2h.02, 2h.03
Estimation, sample size and capture-recapture
Unit 4
Probability
3. Probability: 3p.01, 3p.02, 3p.03, 3p.04
Probability, expected frequency and risk
3. Probability: 3p.05, 3p.06, 3p.10
Experimental and theoretical probability and bias
3. Probability: 3p.11
Binomial distribution
3. Probability: 3p.12, 3p.13
Normal distribution
Avg
score:
–
Topics
done:
0/40

Histograms and frequency density

Practise 19 exam-style questions on Histograms and frequency density for Edexcel GCSE Statistics (Higher Paper 2). Write your answer as you would in the exam and get it marked in seconds against the mark scheme, point by point, with the Study Helper on hand if you get stuck.

  • 19 questions
  • 1–6 marks each
  • Instant marking
  • No sign-up needed
19 questions, marked as you go

Sample questions with model answers

Here are 4 of the questions in this topic, each with a model answer, an explanation of why it earns the marks and the mark scheme an examiner would use.

Question 1

1 mark

At a school competition, students threw paper aeroplanes. Kai drew a histogram of the distances, d m, that the aeroplanes flew. On his histogram, the bars for the classes \(2 < d \le 4\) and \(4 < d \le 8\) are the same height.

Kai says,
"The same number of paper aeroplanes are in each of these two classes."

Explain why Kai is wrong.

Model answer

In a histogram the area of a bar shows the frequency, and the height is the frequency density. The two bars are the same height, but the class \(4 < d \le 8\) is 4 m wide and the class \(2 < d \le 4\) is 2 m wide. So the bar for \(4 < d \le 8\) has twice the area: twice as many paper aeroplanes flew between 4 m and 8 m.

Explanation

Equal heights mean equal frequency densities, not equal frequencies. Frequency = frequency density × class width, so the wider class has the greater frequency. Comparing heights alone is the common error when class widths are unequal.

Mark scheme
  1. 1 mark

    B1 for the frequency is shown by the area of a bar (frequency density × class width), and the class \(4 < d \le 8\) is twice as wide, so it has twice as many aeroplanes oe

    Accept 'frequency = frequency density × width, and the width of 4 to 8 is 4 m but the width of 2 to 4 is 2 m' or 'the bar for 4 to 8 has twice the area'. B0 for 'the classes have different widths' alone, with no reference to area or to the frequencies; B0 for 'the heights show frequency density' alone.
Question 2

2 marks

Freya asked 50 students how long, t hours, they spent on social media one day. She grouped the times like this.
\(0 < t \le 1\): 6 students
\(1 < t \le 2\): 14 students
\(2 < t \le 3\): 12 students
\(3 < t \le 5\): 12 students
\(5 < t \le 8\): 6 students

Freya used classes 1 hour wide for times up to 3 hours, and wider classes for longer times.

Give one reason why Freya might have used wider classes for the longer times, and work out the height of the bar for the class \(5 < t \le 8\) on her histogram.

Model answer

Most students spent up to 3 hours on social media, and fewer spent longer, so the longer times are spread thinly over a wide range. With 1-hour classes above 3 hours, several classes would have very small frequencies (or none), so Freya combined them into wider classes.
Height of the bar for \(5 < t \le 8\) = frequency density = 6 ÷ 3 = 2

Explanation

Unequal class widths are useful when the data are concentrated in one part of the range and sparse in another: narrow classes show detail where most values are, and wide classes avoid near-empty classes in the tail. Because the widths differ, the heights must be frequency densities: the class 5 to 8 hours has the same frequency as 0 to 1 hour but a bar only a third as tall.

Mark scheme
  1. 1 mark

    B1 for a valid reason, e.g. fewer students spent long times on social media (the data are more spread out at the top end), so narrow classes there would have very small or zero frequencies / wider classes there avoid a lot of near-empty classes oe

    Accept 'the times are concentrated below 3 hours, so narrow classes there show the detail where most of the data are'. B0 for 'to make the histogram look better', 'to make it easier' or 'because the data are continuous' with no reference to where the data are concentrated or sparse.

  2. 1 mark

    B1 for 2

    Frequency density = 6 ÷ (8 - 5) = 6 ÷ 3. B0 for 6 (the frequency) or 0.5 (3 ÷ 6). This mark is independent of the first.

Question 3

3 marks

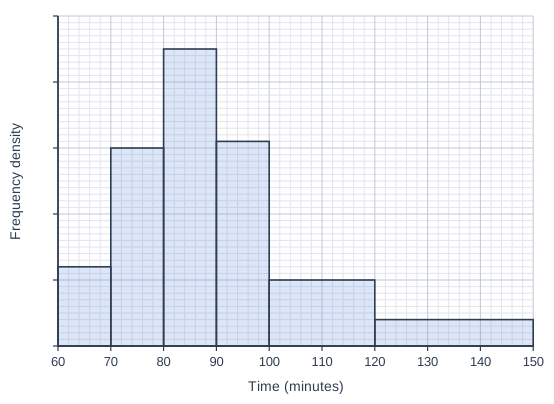
A fell race had 150 runners. Their times, t minutes, are shown in the histogram, but the frequency density axis has not been numbered.

Work out how many of the runners took longer than 100 minutes.

Histogram drawn on a grid of small squares. The horizontal axis is "Time (minutes)", from 60 to 150, numbered every 10, with 5 small squares between numbered values (each small square is 2). The vertical axis is "Frequency density"; it has tick marks every 10 small squares but no numbers. The bars touch, with no gaps between them. Bars: from 60 to 70 (5 small squares wide), 12 small squares tall; from 70 to 80 (5 small squares wide), 30 small squares tall; from 80 to 90 (5 small squares wide), 45 small squares tall; from 90 to 100 (5 small squares wide), 31 small squares tall; from 100 to 120 (10 small squares wide), 10 small squares tall; from 120 to 150 (15 small squares wide), 4 small squares tall.

Model answer

Area of each bar in small squares (width × height):
60 to 70: 5 × 12 = 60; 70 to 80: 5 × 30 = 150; 80 to 90: 5 × 45 = 225; 90 to 100: 5 × 31 = 155; 100 to 120: 10 × 10 = 100; 120 to 150: 15 × 4 = 60
Total area = 750 small squares, which represents 150 runners, so 1 small square = 150 ÷ 750 = 0.2 runners.
More than 100 minutes: (100 + 60) × 0.2 = 32 runners

Explanation

When no class frequency is given, the total frequency still fixes the scale: the total area of all the bars represents all 150 runners. Then use areas, not heights, for the classes you need. Using heights alone ignores that the last two classes are wider than the others.

Mark scheme
  1. 1 mark

    M1 for the total area of the bars (750 small squares) or a scale from the total, e.g. 1 small square = 150 ÷ 750 = 0.2 runners

    Bars (width × height in small squares): 60 to 70: 5 × 12 = 60; 70 to 80: 5 × 30 = 150; 80 to 90: 5 × 45 = 225; 90 to 100: 5 × 31 = 155; 100 to 120: 10 × 10 = 100; 120 to 150: 15 × 4 = 60. Total 750 small squares = 150 runners. Any consistent unit of area may be used. Answer-only rule for this question: A1 for 32 cao A correct answer with no working scores full marks.

  2. 1 mark

    M1 for the area of the bars for \(100 < t \le 120\) and \(120 < t \le 150\) (160 small squares) used with their scale

    e.g. 160 × 0.2, or \(\dfrac{160}{750} \times 150\). Frequencies: 12, 30, 45, 31, 20, 12.

  3. 1 mark

    A1 for 32 cao

    A correct answer with no working scores full marks.

Question 4

4 marks

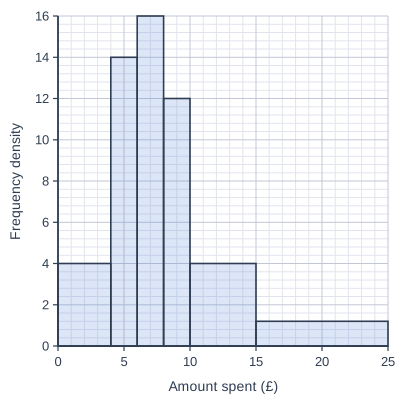
The histogram shows the amounts, £x, that 132 customers spent in a café one Saturday.

The café owner says,
"More than 40% of my customers spend over £9."

Do these data support the owner's claim?
You must show your working.
You should comment on the reliability of your conclusion.

Histogram drawn on a grid of small squares. The horizontal axis is "Amount spent (£)", from 0 to 25, numbered every 5, with 5 small squares between numbered values (each small square is 1). The vertical axis is "Frequency density", from 0 to 16, numbered every 2, with 5 small squares between numbered values (each small square is 0.4). The bars touch, with no gaps between them. Bars: from 0 to 4, height 4; from 4 to 6, height 14; from 6 to 8, height 16; from 8 to 10, height 12; from 10 to 15, height 4; from 15 to 25, height 1.2.

Model answer

Frequencies (frequency density × width): £0 to £4: 4 × 4 = 16; £4 to £6: 14 × 2 = 28; £6 to £8: 16 × 2 = 32; £8 to £10: 12 × 2 = 24; £10 to £15: 4 × 5 = 20; £15 to £25: 1.2 × 10 = 12
Over £9: half of 24 = 12, plus 20 + 12 = 44 customers
\(\dfrac{44}{132} \times 100 = 33.3\%\)
33.3% < 40%, so the data do not support the owner's claim.
The data are for only one Saturday, which may not be typical of the café's customers on other days, so this conclusion may not be reliable.

Explanation

Frequency = frequency density × class width, and the class £8 to £10 is split at £9 by assuming the amounts are spread evenly. Compare the result with 40% of 132 = 52.8, or work out the percentage. A conclusion drawn from one day's data needs a comment on how far it can be trusted for the café's customers in general.

Mark scheme
  1. 1 mark

    M1 for using areas to find frequencies, e.g. at least two of 16, 28, 32, 24, 20, 12, or 12 × 2 = 24 for \(8 < x \le 10\)

    Frequencies (frequency density × width): £0 to £4: 4 × 4 = 16; £4 to £6: 14 × 2 = 28; £6 to £8: 16 × 2 = 32; £8 to £10: 12 × 2 = 24; £10 to £15: 4 × 5 = 20; £15 to £25: 1.2 × 10 = 12 (total 132).

  2. 1 mark

    M1 for \(\dfrac{1}{2} \times 24\) (= 12) for £9 to £10, and their 12 + 20 + 12 (= 44)

    ft their frequencies for £10 to £15 and £15 to £25.

  3. 1 mark

    A1 for No, with correct values, e.g. 44 ÷ 132 × 100 = 33(.3)% and 33% < 40%, or 44 < 52.8 (40% of 132)

    Dependent on both M marks. Answer only scores 0.

  4. 1 mark

    B1 for a valid comment on reliability, e.g. the data are for only one Saturday, which may not be typical of the café's customers on other days / spending on weekdays may be different; or the estimate assumes the amounts from £8 to £10 are spread evenly

    This mark is independent of the others. B0 for 'the sample is small' (132 customers) or 'the data may be biased' with no reason, or for 'the owner may be lying'.

Ready to try the rest? Every answer you write is marked against the mark scheme, so you can see exactly where the marks are.

Study Helper Hints first, answers after you try

Stuck on this one? Ask for a hint and I’ll point you in the right direction, without giving the answer away. Once you’ve checked your answer, I’ll show you how the marks are awarded.