
Level:
Correct: 0
Incorrect: 0
Marks: 0/0
Exam Practice
Course:
Topics:
Edexcel GCSE Statistics (Higher Paper 2) Smart practice A mixed round aimed at your weak spots
Unit 1
The statistical enquiry cycle
Statistical enquiry cycle stages 1 and 2; (a) Planning: 1a.01, 1a.02, 1a.03
Statistical enquiry cycle: planning and collecting
Statistical enquiry cycle stages 3, 4 and 5
Statistical enquiry cycle: interpreting and evaluating
Unit 2
The collection of data
(b) Types of data: 1b.01, 1b.02, 1b.03
Types of data and variables
(b) Types of data: 1b.04; (d) Collecting data: 1d.01, 1d.02
Primary and secondary data, reliability and validity
(c) Population and sampling: 1c.01, 1c.02, 1c.03
Populations, sampling frames and non-random sampling
(c) Population and sampling: 1c.04, 1c.05
Random and systematic sampling
(c) Population and sampling: 1c.06
Stratified sampling
(d) Collecting data: 1d.05, 1d.06
Problems with collected data and cleaning data
Unit 3
Processing, representing and analysing data
(a) Tabulation, diagrams and representation: 2a.01
Tabulation, tallies, pictograms and two-way tables
(a) Tabulation, diagrams and representation: 2a.01, 2a.02
Pie charts and comparative pie charts
(a) Tabulation, diagrams and representation: 2a.01
Stem and leaf diagrams
(a) Tabulation, diagrams and representation: 2a.02
Population pyramids, choropleth maps and 2D and 3D diagrams
(a) Tabulation, diagrams and representation: 2a.04
Histograms and frequency density
(a) Tabulation, diagrams and representation: 2a.05, 2a.06, 2a.07, 2a.08
Choosing representations and misleading diagrams
(a) Tabulation, diagrams and representation: 2a.09, 2a.10
Skewness
(b) Measures of central tendency: 2b.01, 2b.02, 2b.03
Mode, median and mean
(b) Measures of central tendency: 2b.01
Weighted mean and geometric mean
(c) Measures of dispersion: 2c.01, 2c.06
Standard deviation and standardised scores
(a) Tabulation, diagrams and representation: 2a.03; (c) Measures of dispersion: 2c.02, 2c.03
Box plots and outliers
(b) Measures of central tendency: 2b.03; (c) Measures of dispersion: 2c.04, 2c.05
Comparing distributions
(d) Further summary statistics: 2d.01
Index numbers
(d) Further summary statistics: 2d.02
Rates of change
(e) Scatter diagrams and correlation: 2e.01, 2e.02, 2e.03
Scatter diagrams, correlation and causation
(e) Scatter diagrams and correlation: 2e.04
Lines of best fit and regression lines
(e) Scatter diagrams and correlation: 2e.05, 2e.06, 2e.07, 2e.08
Spearman's rank and product moment correlation coefficients
(f) Time series: 2f.01, 2f.02; (b) 2b.01 mean seasonal variation
Time series, moving averages and seasonal variation
(g) Quality assurance: 2g.01, 2g.02
Quality assurance and control charts
(h) Estimation: 2h.01, 2h.02, 2h.03
Estimation, sample size and capture-recapture
Unit 4
Probability
3. Probability: 3p.01, 3p.02, 3p.03, 3p.04
Probability, expected frequency and risk
3. Probability: 3p.05, 3p.06, 3p.10
Experimental and theoretical probability and bias
3. Probability: 3p.11
Binomial distribution
3. Probability: 3p.12, 3p.13
Normal distribution
Avg
score:
–
Topics
done:
0/40

Primary and secondary data, reliability and validity

Practise 16 exam-style questions on Primary and secondary data, reliability and validity for Edexcel GCSE Statistics (Higher Paper 2). Write your answer as you would in the exam and get it marked in seconds against the mark scheme, point by point, with the Study Helper on hand if you get stuck.

  • 16 questions
  • 1–5 marks each
  • Instant marking
  • No sign-up needed
16 questions, marked as you go

Sample questions with model answers

Here are 4 of the questions in this topic, each with a model answer, an explanation of why it earns the marks and the mark scheme an examiner would use.

Question 1

1 mark

Ravi downloads a table of the number of passengers who used a city's tram network on each day last year. He finds it on the tram company's website. Under the table in his report, he writes the name of the company and the web address of the page.

Give a reason why Ravi should also write the date on which he downloaded the data.

Model answer

Websites are often updated: the tram company may correct or add to its figures later. Giving the date shows which version of the data Ravi used, so a reader can check his figures and knows why they may differ from what the website shows now.

Explanation

Sources of secondary data are acknowledged so that readers can find and check the data. Online data can change after you use them, so a full acknowledgement gives the organisation, the web address and the date on which the data were accessed. 'So it is reliable' does not explain how the date helps a reader.

Mark scheme
  1. 1 mark

    B1 for a reason, eg the company may update / correct / change the figures on its website, so a reader who looks later may find different data / the date shows which version of the data he used, so that readers can check his figures against the same version

    oe. The reason must be about the data on the website changing, or about a reader being able to find or check the same version. Do not accept 'so the data are reliable', 'so it is accurate' or 'to show that the data are up to date' on their own, or 'because it is secondary data'.
Question 2

2 marks

Here are descriptions of three studies.

Study A: A company tests three brands of battery. In a room kept at 20 °C, it puts each battery in an identical torch and records how long the torch stays lit.
Study B: A school gives a new spelling scheme to four of its eight Year 8 classes for one term. It then compares their spelling test scores with those of the other four classes.
Study C: A road bridge in a town was closed for six months for repairs. Researchers compare bus journey times on other routes in the town before and during the closure.

For each study, write down whether it is a laboratory experiment, a field experiment or a natural experiment.

Model answer

Study A: laboratory experiment
Study B: field experiment
Study C: natural experiment

Explanation

In a laboratory experiment the researcher controls the explanatory variable and the other conditions in an artificial setting. In a field experiment the researcher still controls the explanatory variable (here, which classes get the new scheme), but in a real-life setting where other variables are not controlled. In a natural experiment the change happens anyway, without the researcher, who simply observes its effect.

Mark scheme
  1. 2 marks

    B2 for all three correct: Study A laboratory experiment, Study B field experiment, Study C natural experiment (B1 for two correct)

    Two correct and one wrong scores B1. An answer giving more than one type for the same study scores 0 for that study. A: the conditions are controlled in an artificial setting. B: the school controls which classes get the scheme, but in their normal lessons, where other variables are not controlled. C: the researchers did not choose to close the bridge; they only observe its effect.

Question 3

3 marks

A delivery company records how long its parcels take to arrive. It uses these probabilities.

Arrives the next day: 0.836
Arrives in two days: 0.127
Takes three days or more: 0.037

Kerry wants to simulate the deliveries of parcels using random numbers.

Explain why two-digit random numbers from 00 to 99 are not suitable for this simulation.
Describe how Kerry could allocate three-digit random numbers from 000 to 999 to the three outcomes.

Model answer

Two-digit numbers give 100 equally likely outcomes, so each stands for 0.01. These probabilities are in thousandths: 0.836 would need 83.6 of the numbers, which is impossible.
With 000 to 999, each number stands for 0.001:
next day: 836 numbers, 000 to 835
two days: 127 numbers, 836 to 962
three days or more: 37 numbers, 963 to 999

Explanation

The random numbers must give each outcome the same probability as the model: with 1000 equally likely three-digit numbers, a probability of 0.836 needs exactly 836 of them. Check that the blocks do not overlap and that their sizes add up to 1000. The usual slip is a block such as 000 to 836, which contains 837 numbers.

Mark scheme
  1. 1 mark

    B1 for explaining that each two-digit number stands for a probability of 0.01, so they can only give probabilities in hundredths, but these probabilities are given to 3 decimal places (eg 0.836 would need 83.6 of the numbers)

    oe. Accept 'there are only 100 two-digit numbers, but the probabilities need 1000 equally likely outcomes'. Do not accept 'there are not enough numbers' with no reference to the third decimal place or to 1000.

  2. 2 marks

    B2 for a complete correct allocation: 836 numbers for next day, 127 numbers for two days and 37 numbers for three days or more, with no number used twice, eg 000-835 next day, 836-962 two days, 963-999 three days or more (B1 for an allocation with one error, eg one boundary slip such as 000-836, 837-963, 964-999 / the correct number of values for only two of the three outcomes)

    Any order and any non-overlapping blocks are fine, eg 000-036 three days or more, 037-163 two days, 164-999 next day. Accept a description such as '836 of the 1000 numbers for next day, 127 for two days and 37 for three days or more'. Two or more errors, or blocks that are not in proportion to the probabilities, score B0.

Question 4

4 marks

Callum's hypothesis is

'House prices have risen by more in Town A than in Town B since 2020.'

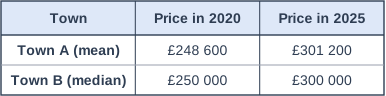
For Town A he uses an estate agent's website, which gives the mean price of the houses that the agent sold. For Town B he uses a council report, which gives the median price of all the houses sold in the town, rounded to the nearest £10 000.

The table shows the prices he finds.

Discuss whether Callum's data are suitable for testing his hypothesis. You should refer to the reliability and the validity of the data.

Table with columns "Town", "Price in 2020", "Price in 2025". Town: Town A (mean); Price in 2020: £248 600; Price in 2025: £301 200 | Town: Town B (median); Price in 2020: £250 000; Price in 2025: £300 000.

Model answer

The Town A average rose by £301 200 - £248 600 = £52 600 (21.2%), and the Town B average by £50 000 (20%), so at first sight the data support Callum.
But the Town B prices are rounded to the nearest £10 000, so the true rise could be anywhere from about £40 000 to £60 000. The difference between the towns is smaller than this, so the data cannot show which rose more.
The towns use different averages: a mean can be pulled up by a few very expensive houses, but a median cannot, so the comparison is not valid. He should use the same average for both towns.
The Town A figures come from one estate agent's own sales, which may not be typical of all the houses sold in Town A, so they are less reliable than the council's figures for every sale.

Explanation

To compare two towns validly, the data must measure the same thing in the same way: the same average, the same kind of houses and the same accuracy. Rounding to the nearest £10 000 can hide a difference of a few thousand pounds, and one agent's sales may not represent a whole town. Each comment needs a reason in context, not just 'unreliable'.

Mark scheme
  1. 4 marks

    B1 for each different valid comment that gives a reason, up to 4, eg
    the Town A price rose by £52 600 (21.2%) and the Town B price by £50 000 (20%), so the figures appear to support the hypothesis, but only just
    the Town B prices are rounded to the nearest £10 000, so the true rise could be anything from about £40 000 to £60 000: the difference between the towns is smaller than this, so the data cannot show which rose more
    the towns use different averages: a mean can be affected by a few very expensive houses but a median is not, so comparing them is not valid / he should use the same average for both
    the Town A data cover only the houses sold by one estate agent, which may not be typical of all the houses sold in Town A (eg the agent may sell mainly larger houses), so they may not be reliable, whereas the council data cover every sale
    the types of house sold may be different in 2020 and 2025, so a change in the average may reflect the mix of houses sold rather than a rise in prices
    the estate agent may have a reason to show high prices / we do not know how the agent's figures were worked out, so they may be less reliable than the council's

    1 mark for each different valid comment, max 4. A judgement alone ('the data are not valid', 'this is unreliable') scores 0: there must be a reason in context. Each bullet can be credited once only. Contradictory comments on the same point score 0. Calculations of the rises earn a mark only with a comment on what they show; values, if given, must be correct. Do not accept 'the data are out of date', 'secondary data are unreliable' or 'the sample is too small' with no reason. Ignore extraneous non-contradictory comments.

Ready to try the rest? Every answer you write is marked against the mark scheme, so you can see exactly where the marks are.

Study Helper Hints first, answers after you try

Stuck on this one? Ask for a hint and I’ll point you in the right direction, without giving the answer away. Once you’ve checked your answer, I’ll show you how the marks are awarded.