
Level:
Correct: 0
Incorrect: 0
Marks: 0/0
Exam Practice
Course:
Topics:
Edexcel GCSE Statistics (Higher Paper 2) Smart practice A mixed round aimed at your weak spots
Unit 1
The statistical enquiry cycle
Statistical enquiry cycle stages 1 and 2; (a) Planning: 1a.01, 1a.02, 1a.03
Statistical enquiry cycle: planning and collecting
Statistical enquiry cycle stages 3, 4 and 5
Statistical enquiry cycle: interpreting and evaluating
Unit 2
The collection of data
(b) Types of data: 1b.01, 1b.02, 1b.03
Types of data and variables
(b) Types of data: 1b.04; (d) Collecting data: 1d.01, 1d.02
Primary and secondary data, reliability and validity
(c) Population and sampling: 1c.01, 1c.02, 1c.03
Populations, sampling frames and non-random sampling
(c) Population and sampling: 1c.04, 1c.05
Random and systematic sampling
(c) Population and sampling: 1c.06
Stratified sampling
(d) Collecting data: 1d.05, 1d.06
Problems with collected data and cleaning data
Unit 3
Processing, representing and analysing data
(a) Tabulation, diagrams and representation: 2a.01
Tabulation, tallies, pictograms and two-way tables
(a) Tabulation, diagrams and representation: 2a.01, 2a.02
Pie charts and comparative pie charts
(a) Tabulation, diagrams and representation: 2a.01
Stem and leaf diagrams
(a) Tabulation, diagrams and representation: 2a.02
Population pyramids, choropleth maps and 2D and 3D diagrams
(a) Tabulation, diagrams and representation: 2a.04
Histograms and frequency density
(a) Tabulation, diagrams and representation: 2a.05, 2a.06, 2a.07, 2a.08
Choosing representations and misleading diagrams
(a) Tabulation, diagrams and representation: 2a.09, 2a.10
Skewness
(b) Measures of central tendency: 2b.01, 2b.02, 2b.03
Mode, median and mean
(b) Measures of central tendency: 2b.01
Weighted mean and geometric mean
(c) Measures of dispersion: 2c.01, 2c.06
Standard deviation and standardised scores
(a) Tabulation, diagrams and representation: 2a.03; (c) Measures of dispersion: 2c.02, 2c.03
Box plots and outliers
(b) Measures of central tendency: 2b.03; (c) Measures of dispersion: 2c.04, 2c.05
Comparing distributions
(d) Further summary statistics: 2d.01
Index numbers
(d) Further summary statistics: 2d.02
Rates of change
(e) Scatter diagrams and correlation: 2e.01, 2e.02, 2e.03
Scatter diagrams, correlation and causation
(e) Scatter diagrams and correlation: 2e.04
Lines of best fit and regression lines
(e) Scatter diagrams and correlation: 2e.05, 2e.06, 2e.07, 2e.08
Spearman's rank and product moment correlation coefficients
(f) Time series: 2f.01, 2f.02; (b) 2b.01 mean seasonal variation
Time series, moving averages and seasonal variation
(g) Quality assurance: 2g.01, 2g.02
Quality assurance and control charts
(h) Estimation: 2h.01, 2h.02, 2h.03
Estimation, sample size and capture-recapture
Unit 4
Probability
3. Probability: 3p.01, 3p.02, 3p.03, 3p.04
Probability, expected frequency and risk
3. Probability: 3p.05, 3p.06, 3p.10
Experimental and theoretical probability and bias
3. Probability: 3p.11
Binomial distribution
3. Probability: 3p.12, 3p.13
Normal distribution
Avg
score:
–
Topics
done:
0/40

Independent events and conditional probability

Practise 16 exam-style questions on Independent events and conditional probability for Edexcel GCSE Statistics (Higher Paper 2). Write your answer as you would in the exam and get it marked in seconds against the mark scheme, point by point, with the Study Helper on hand if you get stuck.

  • 16 questions
  • 1–5 marks each
  • Instant marking
  • No sign-up needed
16 questions, marked as you go

Sample questions with model answers

Here are 4 of the questions in this topic, each with a model answer, an explanation of why it earns the marks and the mark scheme an examiner would use.

Question 1

1 mark

In a penalty practice, Ayo and Ben each take one penalty.
Whether Ayo scores and whether Ben scores are independent.

The probability that both of them score is 0.56
The probability that Ayo scores is 0.8

Work out the probability that Ben scores.

Model answer

For independent events, P(Ayo and Ben score) = P(Ayo scores) \(\times\) P(Ben scores)
\(0.56 = 0.8 \times P(\text{Ben scores})\)
P(Ben scores) \(= 0.56 \div 0.8 = 0.7\)

Explanation

The multiplication law \(P(A \text{ and } B) = P(A) \times P(B)\) holds for independent events, so the unknown probability is found by dividing. Multiplying 0.56 by 0.8, or subtracting, does not undo the multiplication law.

Mark scheme
  1. 1 mark

    B1 for 0.7 oe

    From \(0.56 \div 0.8\). Accept 70% or \(\dfrac{7}{10}\). B0 for 0.448 (\(0.56 \times 0.8\)) or 0.24 (\(0.8 - 0.56\)). Probabilities must be fractions, decimals or percentages: ratio notation (e.g. 7 : 24) or 'out of' wording (e.g. '7 out of 24') scores A0/B0 for this mark (Pearson's general marking guidance).
Question 2

2 marks

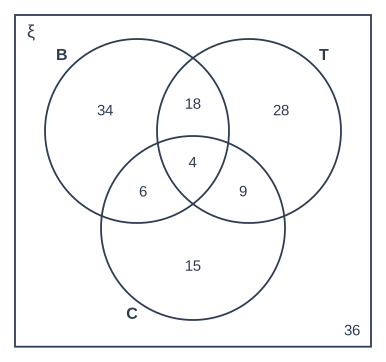
150 commuters were asked which of bus (B), train (T) and bicycle (C) they had used for travelling to work last week.
The Venn diagram shows the results.

One of the commuters who used the train is chosen at random.

Find the probability that this commuter used neither a bus nor a bicycle last week.

A Venn diagram: a rectangle labelled ξ (the universal set) containing three overlapping circles labelled B, T and C, each overlapping the other two. The numbers written in each region are: B ∩ T′ ∩ C′ (in B only): 34; B′ ∩ T ∩ C′ (in T only): 28; B′ ∩ T′ ∩ C (in C only): 15; B ∩ T ∩ C′ (in B and T but not C): 18; B ∩ T′ ∩ C (in B and C but not T): 6; B′ ∩ T ∩ C (in T and C but not B): 9; B ∩ T ∩ C (in all three): 4; B′ ∩ T′ ∩ C′ (outside all three circles): 36.

Model answer

Commuters who used the train: 28 + 18 + 9 + 4 = 59
Of these, 28 used the train only (neither a bus nor a bicycle).
P(neither bus nor bicycle | train) \(= \dfrac{28}{59}\)

Explanation

The commuter is chosen from those who used the train, so the denominator is the total of the four regions inside circle T. The numerator is the part of T outside both other circles. Dividing by 150 finds the probability for a commuter chosen from everyone, which ignores the condition.

Mark scheme
  1. 1 mark

    M1 for a denominator of 59 (the number of commuters who used the train: 28 + 18 + 9 + 4)

    e.g. \(\dfrac{k}{59}\) with 0 < k < 59, or \(\dfrac{28/150}{59/150}\). Answer-only rule for this question: A correct answer with no working scores M1A1.

  2. 1 mark

    A1 for \(\dfrac{28}{59}\) oe

    Accept 0.47 or 0.475 or better (0.4745...), or 47.5%. 0.48 is not accepted (0.4745... rounds to 0.47). A correct answer with no working scores M1A1. \(\dfrac{28}{150}\) (not conditional) scores M0A0.

Question 3

3 marks

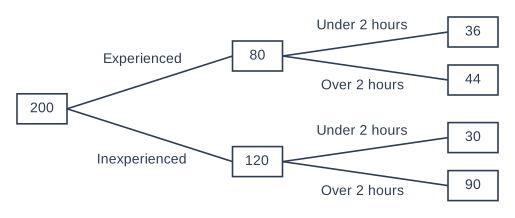
200 runners took part in a fell race.
The frequency tree shows whether each runner was experienced or inexperienced, and whether they finished the race in under 2 hours or over 2 hours. No runner took exactly 2 hours.

Use probabilities to determine whether the events 'the runner is experienced' and 'the runner finished in under 2 hours' are independent.
You must show your working.

A frequency tree drawn from left to right with 2 stages of branches. It starts from a box containing 200 on the left. From the first box, branches labelled "Experienced" and "Inexperienced" lead to a box containing 80 and a box containing 120 respectively. From the "Experienced" box, branches labelled "Under 2 hours" and "Over 2 hours" lead to a box containing 36 and a box containing 44 respectively. From the "Inexperienced" box, branches labelled "Under 2 hours" and "Over 2 hours" lead to a box containing 30 and a box containing 90 respectively.

Model answer

P(under 2 hours) \(= \dfrac{36 + 30}{200} = \dfrac{66}{200} = 0.33\)
P(under 2 hours | experienced) \(= \dfrac{36}{80} = 0.45\)

0.45 ≠ 0.33, so the events are not independent.
(An experienced runner was more likely to finish in under 2 hours.)

Explanation

Two events are independent if knowing that one happened does not change the probability of the other, so compare P(under 2 hours | experienced) with P(under 2 hours), or compare P(experienced and under 2 hours) with the product of the separate probabilities. A conclusion needs the calculation: a purely descriptive answer earns no credit.

Mark scheme
  1. 1 mark

    M1 for a relevant probability, e.g. P(under 2 hours) \(= \dfrac{66}{200}\), P(under 2 hours | experienced) \(= \dfrac{36}{80}\), P(experienced | under 2 hours) \(= \dfrac{36}{66}\) or P(experienced and under 2 hours) \(= \dfrac{36}{200}\)

    oe. P(experienced) = \(\dfrac{80}{200}\) alone is not enough.

  2. 1 mark

    A1 for a correct pair of values to compare, e.g. P(under 2 hours | experienced) = 0.45 and P(under 2 hours) = 0.33, or P(experienced) \(\times\) P(under 2 hours) = 0.132 and P(experienced and under 2 hours) = 0.18, or P(experienced | under 2 hours) = 0.545 and P(experienced) = 0.4

    Also accept P(under 2 hours | experienced) = 0.45 and P(under 2 hours | inexperienced) = 0.25. Accept equivalent fractions; awrt 0.55 for 0.5454...

  3. 1 mark

    B1 for not independent, because the two values are not equal (e.g. 0.45 ≠ 0.33)

    Dependent on the M1. ft a conclusion consistent with their two values if they are a valid pair to compare (as listed for the A1) and come from a correct method with an arithmetic slip. The question says 'You must show your working': a conclusion with no calculation scores 0. B0 for a reason that is only descriptive, e.g. 'experienced runners are faster', or that is about mutually exclusive events.

Question 4

4 marks

A survey of the 400 households on a new housing estate found that 45% of the households have solar panels.

For a household in the survey chosen at random,
S is the event 'the household has solar panels'
E is the event 'the household has an electric car'.

\(P(E \mid S) = 0.3\)   \(P(S \mid E) = 0.6\)

Work out the number of households in the survey that have neither solar panels nor an electric car.

Model answer

Households with solar panels \(= 0.45 \times 400 = 180\)
Both solar panels and an electric car \(= P(E \mid S) \times 180 = 0.3 \times 180 = 54\)
\(P(S \mid E) = \dfrac{54}{\text{number with an electric car}} = 0.6\), so the number with an electric car \(= 54 \div 0.6 = 90\)

Solar panels or an electric car (or both) \(= 180 + 90 - 54 = 216\)
Neither \(= 400 - 216 = 184\)

Explanation

Each conditional probability links the overlap to a different total: P(E | S) is the overlap as a fraction of the solar-panel households, and P(S | E) is the overlap as a fraction of the electric-car households. Find the overlap first, then use P(S | E) to work back to the number with electric cars. The households with neither are what is left after the general addition law.

Mark scheme
  1. 1 mark

    M1 for the number with both: \(0.3 \times 180\) (= 54), or \(P(S \text{ and } E) = 0.3 \times 0.45\) (= 0.135)

    180 = 45% of 400 households with solar panels. Answer-only rule for this question: A correct answer with no working scores full marks.

  2. 1 mark

    M1 for the number with an electric car: their \(54 \div 0.6\) (= 90), or \(P(E) = \text{their } 0.135 \div 0.6\) (= 0.225)

    \(0.6 \times 400\) (= 240) or \(0.6 \times 54\) scores M0.

  3. 1 mark

    M1 for \(400 - (180 + \text{their } 90 - \text{their } 54)\) oe

    e.g. from a Venn diagram with S only 126, both 54, E only 36; or \(1 - (0.45 + 0.225 - 0.135)\) (= 0.46) with \(\times\) 400 to follow. \(400 - 180 - 90\) (= 130, not subtracting the overlap) scores M0.

  4. 1 mark

    A1 for 184

    cao (must be a number of households, not the probability 0.46). A correct answer with no working scores full marks.

Ready to try the rest? Every answer you write is marked against the mark scheme, so you can see exactly where the marks are.

Study Helper Hints first, answers after you try

Stuck on this one? Ask for a hint and I’ll point you in the right direction, without giving the answer away. Once you’ve checked your answer, I’ll show you how the marks are awarded.