Level:
Correct: 0
Incorrect: 0
Marks: 0/0
Exam Practice
Course:
Topics:
Edexcel GCSE Statistics (Higher Paper 2) Smart practice A mixed round aimed at your weak spots
Unit 1
The statistical enquiry cycle
Statistical enquiry cycle stages 1 and 2; (a) Planning: 1a.01, 1a.02, 1a.03
Statistical enquiry cycle: planning and collecting
Statistical enquiry cycle stages 3, 4 and 5
Statistical enquiry cycle: interpreting and evaluating
Unit 2
The collection of data
(b) Types of data: 1b.01, 1b.02, 1b.03
Types of data and variables
(b) Types of data: 1b.04; (d) Collecting data: 1d.01, 1d.02
Primary and secondary data, reliability and validity
(c) Population and sampling: 1c.01, 1c.02, 1c.03
Populations, sampling frames and non-random sampling
(c) Population and sampling: 1c.04, 1c.05
Random and systematic sampling
(c) Population and sampling: 1c.06
Stratified sampling
(d) Collecting data: 1d.05, 1d.06
Problems with collected data and cleaning data
Unit 3
Processing, representing and analysing data
(a) Tabulation, diagrams and representation: 2a.01
Tabulation, tallies, pictograms and two-way tables
(a) Tabulation, diagrams and representation: 2a.01, 2a.02
Pie charts and comparative pie charts
(a) Tabulation, diagrams and representation: 2a.01
Stem and leaf diagrams
(a) Tabulation, diagrams and representation: 2a.02
Population pyramids, choropleth maps and 2D and 3D diagrams
(a) Tabulation, diagrams and representation: 2a.04
Histograms and frequency density
(a) Tabulation, diagrams and representation: 2a.05, 2a.06, 2a.07, 2a.08
Choosing representations and misleading diagrams
(a) Tabulation, diagrams and representation: 2a.09, 2a.10
Skewness
(b) Measures of central tendency: 2b.01, 2b.02, 2b.03
Mode, median and mean
(b) Measures of central tendency: 2b.01
Weighted mean and geometric mean
(c) Measures of dispersion: 2c.01, 2c.06
Standard deviation and standardised scores
(a) Tabulation, diagrams and representation: 2a.03; (c) Measures of dispersion: 2c.02, 2c.03
Box plots and outliers
(b) Measures of central tendency: 2b.03; (c) Measures of dispersion: 2c.04, 2c.05
Comparing distributions
(d) Further summary statistics: 2d.01
Index numbers
(d) Further summary statistics: 2d.02
Rates of change
(e) Scatter diagrams and correlation: 2e.01, 2e.02, 2e.03
Scatter diagrams, correlation and causation
(e) Scatter diagrams and correlation: 2e.04
Lines of best fit and regression lines
(e) Scatter diagrams and correlation: 2e.05, 2e.06, 2e.07, 2e.08
Spearman's rank and product moment correlation coefficients
(f) Time series: 2f.01, 2f.02; (b) 2b.01 mean seasonal variation
Time series, moving averages and seasonal variation
(g) Quality assurance: 2g.01, 2g.02
Quality assurance and control charts
(h) Estimation: 2h.01, 2h.02, 2h.03
Estimation, sample size and capture-recapture
Unit 4
Probability
3. Probability: 3p.01, 3p.02, 3p.03, 3p.04
Probability, expected frequency and risk
3. Probability: 3p.05, 3p.06, 3p.10
Experimental and theoretical probability and bias
3. Probability: 3p.11
Binomial distribution
3. Probability: 3p.12, 3p.13
Normal distribution
Avg
score:
–
Topics
done:
0/40

Range, quartiles, percentiles and interpercentile ranges

Practise 15 exam-style questions on Range, quartiles, percentiles and interpercentile ranges for Edexcel GCSE Statistics (Higher Paper 2). Write your answer as you would in the exam and get it marked in seconds against the mark scheme, point by point, with the Study Helper on hand if you get stuck.

  • 15 questions
  • 1–5 marks each
  • Instant marking
  • No sign-up needed
15 questions, marked as you go

Sample questions with model answers

Here are 4 of the questions in this topic, each with a model answer, an explanation of why it earns the marks and the mark scheme an examiner would use.

Question 1

1 mark

An estate agent manages 80 flats in a town. She works out that the interquartile range of the monthly rents of these flats is £180.

Interpret this value in context.

Model answer

The middle 50% of the monthly rents of the flats are spread over a range of £180: the upper quartile of the rents is £180 more than the lower quartile.

Explanation

The interquartile range is the upper quartile minus the lower quartile, so it measures the spread of the middle half of the data, ignoring the lowest and highest quarters. An interpretation must say that it is the middle 50% that is spread over £180; saying the rents vary by £180 describes the range, not the interquartile range.

Mark scheme
  1. 1 mark

    B1 for the middle 50% (middle half) of the monthly rents are spread over a range of £180

    Must refer to the middle 50% (or middle half) and be in context (the rents or the flats). Accept 'the middle half of the rents lie within £180 of each other' or 'the rents of the middle 40 flats differ by at most £180'. B0 for 'the upper quartile minus the lower quartile is £180' on its own (this restates the definition), for 'the rents vary by £180' or 'the range of the rents is £180' (no middle 50%), '50% of the rents are £180', 'the average rent is £180', or 'the rents are spread out' with no value.
Question 2

2 marks

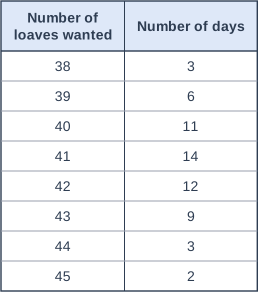
A bakery recorded how many sourdough loaves its customers wanted to buy on each of 60 days. The table shows the results.

The bakery wants to bake enough sourdough loaves each day to meet the demand on about 90% of days. It decides to bake the number of loaves given by the 90th percentile of the numbers of loaves wanted.

Find the 90th percentile of the numbers of loaves wanted.

Table with columns "Number of loaves wanted", "Number of days". Number of loaves wanted: 38; Number of days: 3 | Number of loaves wanted: 39; Number of days: 6 | Number of loaves wanted: 40; Number of days: 11 | Number of loaves wanted: 41; Number of days: 14 | Number of loaves wanted: 42; Number of days: 12 | Number of loaves wanted: 43; Number of days: 9 | Number of loaves wanted: 44; Number of days: 3 | Number of loaves wanted: 45; Number of days: 2.

Model answer

90th percentile: \(0.9 \times 60 = 54\)th value
Cumulative frequencies: 3, 9, 20, 34, 46, 55, 58, 60
The 47th to 55th values are 43, so the 54th value is 43.
90th percentile = 43 loaves
(On 55 of the 60 days, about 92%, the demand was 43 loaves or fewer.)

Explanation

The 90th percentile is the value that 90% of the data are less than or equal to, so for 60 days it is the 54th value in order. Use cumulative frequencies to find which number of loaves the 54th day had. Percentiles are useful for decisions like this one, where a business wants to cover most, but not all, of the possible demand.

Mark scheme
  1. 1 mark

    M1 for \(0.9 \times 60\) (= 54) oe and a correct attempt to locate the 54th value, eg cumulative frequencies 3, 9, 20, 34, 46, 55

    Accept \(0.9 \times 61\) (= 54.9) for the position. Implied by the correct answer.

  2. 1 mark

    A1 for 43 (loaves)

    cao. The 54th and 55th values are both 43, so every usual convention gives 43. A correct answer with no working scores M1A1. 54 or 54.9 (the position) as the answer scores M1A0. 42 or 44 scores M1A0 if 54 (or 54.9) is seen, otherwise M0A0. 39 (the 10th percentile) scores M0A0.

Question 3

3 marks

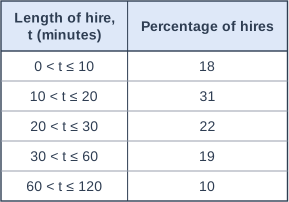
A council's cycle-hire scheme recorded the length, t minutes, of every hire last year. The table shows the percentage of the hires in each class.

Use linear interpolation to find an estimate of the interquartile range of the lengths of the hires.
Give your answer correct to 1 decimal place.

Table with columns "Length of hire, t (minutes)", "Percentage of hires". Length of hire, t (minutes): 0 < t ≤ 10; Percentage of hires: 18 | Length of hire, t (minutes): 10 < t ≤ 20; Percentage of hires: 31 | Length of hire, t (minutes): 20 < t ≤ 30; Percentage of hires: 22 | Length of hire, t (minutes): 30 < t ≤ 60; Percentage of hires: 19 | Length of hire, t (minutes): 60 < t ≤ 120; Percentage of hires: 10.

Model answer

The percentages act as frequencies out of 100. Cumulative percentages: 18, 49, 71, 90, 100
Lower quartile: 25% is in the class 10 < t ≤ 20: \(10 + \dfrac{25 - 18}{31} \times 10 = 12.258...\) minutes
Upper quartile: 75% is in the class 30 < t ≤ 60: \(30 + \dfrac{75 - 71}{19} \times 30 = 36.315...\) minutes
IQR = \(36.315... - 12.258... = 24.057...\) = 24.1 minutes (1 dp)

Explanation

The number of hires is not needed: the percentages work as frequencies for every 100 hires, so the quartiles are at 25% and 75%. Find each quartile by interpolation inside its own class, taking care with the unequal class widths (the upper quartile's class is 30 minutes wide). Keep the unrounded quartiles until the final subtraction.

Mark scheme
  1. 1 mark

    M1 for a correct method to estimate the lower quartile, eg \(10 + \dfrac{25 - 18}{31} \times 10\) (= 12.25...)

    The lower quartile is at 25% of the hires (cumulative percentages 18, 49, 71, 90, 100). Also accept working down from the upper bound, eg \(20 - \dfrac{49 - 25}{31} \times 10\).

  2. 1 mark

    M1 for a correct method to estimate the upper quartile, eg \(30 + \dfrac{75 - 71}{19} \times 30\) (= 36.31...)

    The upper quartile is at 75%. Also accept working down from the upper bound, eg \(60 - \dfrac{90 - 75}{19} \times 30\). The class 30 < t ≤ 60 is 30 minutes wide: using 10 (giving 32.1) scores M0.

  3. 1 mark

    A1 for awrt 24.1 (minutes)

    24.057...; accept 24.06 or better. awrt 24.1 with no working scores M1M1A1. 19.8 (19.847..., using a width of 10 for the upper quartile) scores M1M0A0. 50 (75 - 25, subtracting the percentages) scores M0M0A0.

Question 4

4 marks

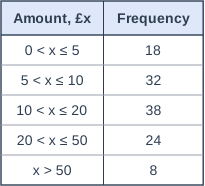
A charity recorded the amount, £x, given by each of 120 people at a fundraising event. The table gives information about the amounts.

Work out an estimate of the interquartile range of the amounts.
Give your answer correct to the nearest penny.

Explain why the interquartile range is a more suitable measure of spread than the standard deviation for these data.

Table with columns "Amount, £x", "Frequency". Amount, £x: 0 < x ≤ 5; Frequency: 18 | Amount, £x: 5 < x ≤ 10; Frequency: 32 | Amount, £x: 10 < x ≤ 20; Frequency: 38 | Amount, £x: 20 < x ≤ 50; Frequency: 24 | Amount, £x: x > 50; Frequency: 8.

Model answer

n = 120. Cumulative frequencies: 18, 50, 88, 112, 120
Lower quartile: the \(120 \div 4 = 30\)th value, in the class 5 < x ≤ 10: \(5 + \dfrac{30 - 18}{32} \times 5 = 6.875\)
Upper quartile: the \(3 \times 120 \div 4 = 90\)th value, in the class 20 < x ≤ 50: \(20 + \dfrac{90 - 88}{24} \times 30 = 22.5\)
IQR = \(22.5 - 6.875 = 15.625\), so about £15.63

The last class, more than £50, has no upper boundary, so it has no midpoint and the standard deviation cannot be estimated. Both quartiles lie in classes whose boundaries are known, so the IQR can be estimated.

Explanation

Estimating a standard deviation (or a mean) from grouped data needs the midpoint of every class, which an open-ended class such as 'more than £50' does not have. The quartiles only need the classes they lie in, and here neither is in the open class. Open classes often hold a few extreme values, which also makes a measure based on the middle 50% more suitable.

Mark scheme
  1. 1 mark

    M1 for a correct method to estimate the lower quartile, eg \(5 + \dfrac{30 - 18}{32} \times 5\) (= 6.875)

    Accept 30.25 for 30, giving 6.914... Also accept working down from the upper bound, eg \(10 - \dfrac{50 - 30}{32} \times 5\). Answer-only rule for this question: An answer in this range with no working scores M1M1A1.

  2. 1 mark

    M1 for a correct method to estimate the upper quartile, eg \(20 + \dfrac{90 - 88}{24} \times 30\) (= 22.5)

    Accept 90.75 for 90, giving 23.4375. Also accept working down from the upper bound, eg \(50 - \dfrac{112 - 90}{24} \times 30\). The class 20 < x ≤ 50 is 30 wide.

  3. 1 mark

    A1 for (£)15.63, or (£)16.52 if (n + 1) positions are used

    Accept any answer from 15.58 to 16.57 inclusive from a correct method (15.625 with n/4 and 3n/4; 16.523... with (n + 1)/4 and 3(n + 1)/4; 15.59 or 16.56 if the conventions are mixed). An answer in this range with no working scores M1M1A1.

  4. 1 mark

    B1 for a reason, eg the last class (more than £50) is open-ended, so it has no midpoint and the standard deviation cannot be estimated, but both quartiles are in classes with known boundaries

    Independent of the calculation. Also accept 'there may be some very large (extreme) donations in the top class, which would affect the standard deviation but not the IQR'. B0 for 'the IQR is easier to work out', 'the IQR is more accurate' with no reason, or 'the standard deviation needs all the data' on its own.

Ready to try the rest? Every answer you write is marked against the mark scheme, so you can see exactly where the marks are.

Study Helper Hints first, answers after you try

Stuck on this one? Ask for a hint and I’ll point you in the right direction, without giving the answer away. Once you’ve checked your answer, I’ll show you how the marks are awarded.