Level:
Correct: 0
Incorrect: 0
Marks: 0/0
Practice
Course:
Topics:
Year 6 Maths Smart practice A mixed round aimed at your weak spots
Unit 1
Place value
Number and place value
Numbers up to ten million
Quick practice5 skills
Rounding whole numbers
Quick practice5 skills
Negative numbers
Quick practice5 skills
Roman numerals
Quick practice4 skills
Unit 2
Calculating
Unit 3
Fractions
Unit 4
Decimals
Unit 5
Fractions, decimals and percentages
Unit 6
Ratio and proportion
Unit 7
Algebra
Unit 8
Measurement
Unit 9
Shapes and angles
Unit 10
Position and direction
Geometry: position and direction
Coordinates in four quadrants
Quick practice5 skills
Translations
Quick practice4 skills
Reflections
Quick practice4 skills
Unit 11
Statistics
Avg
score:
–
Topics
done:
0/60

Tables, timetables and bar charts

Practise 20 questions on Tables, timetables and bar charts for Year 6 Maths. Tap your answer and find out straight away if you are right, with the Study Helper on hand if you get stuck.

  • 20 questions
  • 1–4 marks each
  • Instant marking
  • No sign-up needed
20 questions, marked as you go

Sample questions with model answers

Here are 4 of the questions in this topic, each with a model answer, an explanation of why it earns the marks and the mark scheme.

Question 1

1 mark

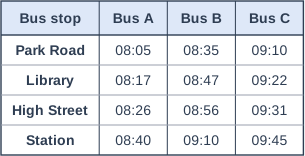
The table shows part of a bus timetable.

Amy gets to the Library bus stop at 08:40.

What time does the next bus leave the Library?

Table with columns "Bus stop", "Bus A", "Bus B", "Bus C". Bus stop: Park Road; Bus A: 08:05; Bus B: 08:35; Bus C: 09:10 | Bus stop: Library; Bus A: 08:17; Bus B: 08:47; Bus C: 09:22 | Bus stop: High Street; Bus A: 08:26; Bus B: 08:56; Bus C: 09:31 | Bus stop: Station; Bus A: 08:40; Bus B: 09:10; Bus C: 09:45.

Model answer

Look along the Library row: 08:17, 08:47, 09:22.
08:17 has already gone, so the next bus is at 08:47.

Explanation

Find the row for the stop Amy is at, then read along it. The 08:17 bus has already left by 08:40, so the next one is Bus B at 08:47. A common mistake is to read the time from the wrong row, such as the time Bus B leaves Park Road.

Mark scheme
  1. 1 mark

    08:47

    Accept 8:47, 8.47, 8:47 am, 0847 or '13 minutes to 9'. Do not accept 08:35 (when Bus B leaves Park Road) or 09:22.

Question 2

2 marks

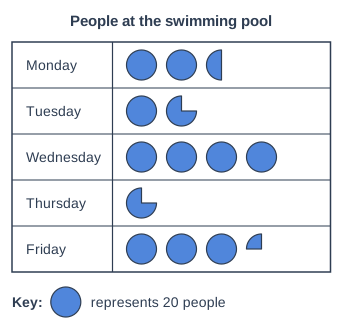
The pictogram shows the number of people who went to a swimming pool each day from Monday to Friday.

How many people went to the swimming pool altogether from Monday to Friday?

Pictogram titled "People at the swimming pool", a table with 5 rows of circle symbols. Key: one circle represents 20 people. Monday: 2 and a half circles. Tuesday: 1 and three quarters circles. Wednesday: 4 circles. Thursday: three quarters of a circle. Friday: 3 and a quarter circles.

Model answer

One circle is 20 people, so a quarter circle is 5 people.
Monday 50, Tuesday 35, Wednesday 80, Thursday 15, Friday 65
\(50 + 35 + 80 + 15 + 65 = 245\) people

Explanation

Use the key: one circle is 20 people, so half a circle is 10 and a quarter of a circle is 5. Work out each day, then add them. Adding numbers that make 100 first helps: \(50 + 35 + 15 = 100\), then \(80 + 65 = 145\), so 245 altogether. A common mistake is to treat a part circle as a whole one.

Mark scheme
  1. 1 mark

    At least four of the five days read correctly: Monday 50, Tuesday 35, Wednesday 80, Thursday 15, Friday 65; or the correct answer 245 with no working

    Or the total number of circles, \(12\dfrac{1}{4}\), multiplied by 20.

  2. 1 mark

    245

    A correct answer with no working scores full marks.

Question 3

2 marks

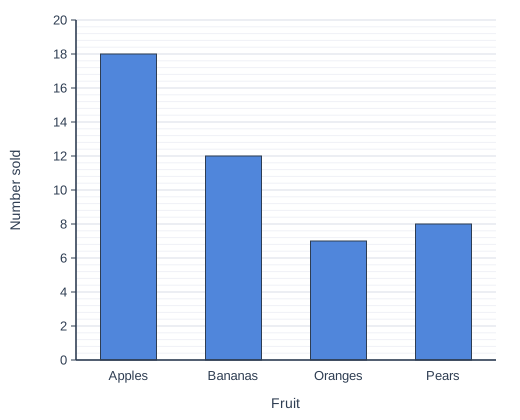
The bar chart shows the fruit sold at a school tuck shop on Monday.

Tom says, "Twice as many apples were sold as pears."

Is Tom right? How do you know?

Bar chart of number sold for each fruit: Apples 18, Bananas 12, Oranges 7, Pears 8.

Model answer

No. 18 apples and 8 pears were sold. Twice 8 is 16, but 18 apples were sold, so it is more than twice as many.

Explanation

Read the two bars exactly: apples 18 and pears 8. Twice as many as 8 would be \(8 \times 2 = 16\), and 18 is not 16. The bars look close to double, which is why you must read the scale rather than judge by eye.

Mark scheme
  1. 1 mark

    No, with a relevant but incomplete reason, e.g. 'the numbers are 18 and 8' without comparing them, or 'it is not exactly double'

    'No' alone scores 0.

  2. 1 mark

    No, with a complete correct reason, e.g. 18 apples and 8 pears were sold, and twice 8 is 16, not 18; or half of 18 is 9, not 8; or 18 is more than twice 8

    A complete correct reason on its own scores both marks. The reason must use the values 18 and 8 (or 16 or 9) correctly.

Question 4

4 marks

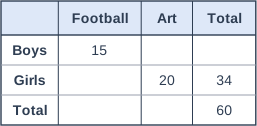
60 children go to a holiday club. Each child chooses football or art. The two-way table shows some of the information.

How many more children choose art than football?

Table with columns (row headings), "Football", "Art", "Total". Boys; Football: 15; Art: (blank); Total: (blank) | Girls; Football: (blank); Art: 20; Total: 34 | Total; Football: (blank); Art: (blank); Total: 60.

Model answer

Boys: \(60 - 34 = 26\)
Boys who choose art: \(26 - 15 = 11\)
Art: \(11 + 20 = 31\)
Football: \(60 - 31 = 29\)
\(31 - 29 = 2\) more children choose art.

Explanation

Fill in the two-way table one number at a time, always using a row or column where only one number is missing. There are \(60 - 34 = 26\) boys, so \(26 - 15 = 11\) boys choose art. That makes \(11 + 20 = 31\) children choosing art and \(60 - 31 = 29\) choosing football. So 2 more children choose art. Check that your totals add up to 60.

Mark scheme
  1. 1 mark

    A correct first step, e.g. \(60 - 34 = 26\) boys, or \(34 - 20 = 14\) girls choose football; or the correct answer 2 with no working

  2. 1 mark

    A correct second value, e.g. 11 boys choose art (\(26 - 15\)), or 29 children choose football (\(15 + 14\))

  3. 1 mark

    Both totals correct: 31 children choose art and 29 choose football

    Follow through from one earlier error if both totals add up to 60.

  4. 1 mark

    2 (more children choose art)

    Follow through: the difference between their two totals, if they add up to 60. A correct answer with no working scores full marks.

Ready to try the rest? Tap your answers and see straight away how you did.

Topic notes

Tables, timetables and bar charts

The big idea

Tables and charts organise data (facts and numbers that have been collected) so that you can find answers quickly. Before you use one, ask: what is it about, and what does each number count? Then read the values carefully, and add, subtract or compare them to answer the question.

Tally charts and tables

A tally chart counts with marks. Every fifth mark is drawn across the four before it, making a bundle of 5. Count the bundles in fives, then add the single marks: two bundles and 3 single marks show 13. The number of times something happens is its frequency.

A two-way table sorts data in two ways at once, such as adults or children, and which day they visited a museum. The numbers along a row make that row's total, and the numbers down a column make that column's total. To fill a gap, find a row or column with only one number missing.

SaturdaySundayTotal
Adults17?32
Children132134
Total303666

The Adults row has one gap: \(32 - 17 = 15\). Check with the Sunday column: \(36 - 21 = 15\) too.

A table or chart can only answer questions about what it shows. This one says nothing about Monday, or about how long each visitor stayed.

Timetables

A timetable usually has a column for each bus or train and a row for each stop. Read down a column to follow one bus on its journey. Read along a row to see every time a bus leaves one stop. Times are often written in the 24-hour clock.

Every bus takes the same time to get from Park Lane to the Zoo. One time is missing from this timetable. What should it be?

StopBus 1Bus 2Bus 3
Park Lane09:1009:5510:40
Zoo09:38?11:08

Bus 1 takes from 09:10 to 09:38. Count on: that is 28 minutes.

Bus 2 leaves Park Lane at 09:55. Add 28 minutes: 5 minutes takes it to 10:00, and 23 more makes 10:23.

Check with Bus 3: 10:40 plus 28 minutes is 11:08, which matches the timetable.

Bar charts and pictograms

On a bar chart, the height of each bar shows a value. First work out the scale: take two numbered lines next to each other, find the difference between them, and share it between the gaps. If a bar ends halfway between two lines, its value is halfway between theirs.

This bar chart gives the number of people who visited a castle on four days. Did more people visit on Saturday than on Thursday and Friday together? By how many?

Bar chart of number of visitors for each day: Thursday 125, Friday 175, Saturday 275, Sunday 250.
Visitors to a castle on four days. The faint lines are 10 visitors apart.

The scale goes up in 50s. Thursday is halfway between 100 and 150: 125. Friday is halfway between 150 and 200: 175. Saturday is halfway between 250 and 300: 275.

Thursday and Friday together: \(125 + 175 = 300\).

300 is more than 275, so no: Saturday had 25 fewer visitors than Thursday and Friday together.

A pictogram uses symbols. The key says what one whole symbol stands for. Part of a symbol stands for part of that amount.

In this pictogram one circle stands for 12 cakes. On Thursday the café sold 27 cakes. How many circles should go in the Thursday row?

Pictogram titled "Cakes sold at the café", a table with 4 rows of circle symbols. Key: one circle represents 12 cakes. Monday: 3 circles = 36 cakes. Tuesday: 1 and three quarters circles = 21 cakes. Wednesday: 3 and a half circles = 42 cakes. Thursday: blank row (nothing drawn yet). Total of the rows that are drawn: 99 cakes.
Each quarter circle stands for 3 cakes, and each half circle for 6 cakes.

One circle is 12 cakes, so 2 circles are 24 cakes.

That leaves \(27 - 24 = 3\) cakes. One quarter of a circle stands for \(12 \div 4 = 3\) cakes.

Thursday needs 2 and a quarter circles.

Common mistakes

  • Counting a tally bundle as 4 marks, or as 1. Each bundle is 5.
  • Taking every line on a bar chart's scale to be worth 1. Work out the scale first.
  • Counting pictogram symbols instead of using the key, or ignoring part symbols.
  • Reading a time from the wrong row or column of a timetable.
  • Adding when the question says "how many more". That means find the difference.

Top tip

Put a finger on the row and another on the column you need, or lay a ruler from the top of a bar across to the scale. It stops your eyes slipping to the wrong number.

Study Helper Hints first, answers after you try

Stuck on this one? Ask for a hint and I’ll point you in the right direction, without giving the answer away. Once you’ve checked your answer, I’ll show you how the marks are awarded.