Level:
Correct: 0
Incorrect: 0
Marks: 0/0
Practice
Course:
Topics:
Year 6 Maths Smart practice A mixed round aimed at your weak spots
Unit 1
Place value
Number and place value
Numbers up to ten million
Quick practice5 skills
Rounding whole numbers
Quick practice5 skills
Negative numbers
Quick practice5 skills
Roman numerals
Quick practice4 skills
Unit 2
Calculating
Unit 3
Fractions
Unit 4
Decimals
Unit 5
Fractions, decimals and percentages
Unit 6
Ratio and proportion
Unit 7
Algebra
Unit 8
Measurement
Unit 9
Shapes and angles
Unit 10
Position and direction
Geometry: position and direction
Coordinates in four quadrants
Quick practice5 skills
Translations
Quick practice4 skills
Reflections
Quick practice4 skills
Unit 11
Statistics
Avg
score:
–
Topics
done:
0/60

Line graphs

Practise 22 questions on Line graphs for Year 6 Maths. Tap your answer and find out straight away if you are right, with the Study Helper on hand if you get stuck.

  • 22 questions
  • 1–5 marks each
  • Instant marking
  • No sign-up needed
20 questions, marked as you go

Sample questions with model answers

Here are 4 of the questions in this topic, each with a model answer, an explanation of why it earns the marks and the mark scheme.

Question 1

1 mark

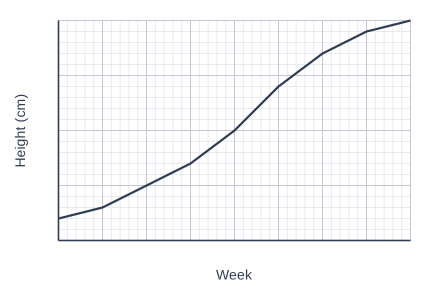
Oscar measured the height of his sunflower at the end of each week. The line graph shows his results.

How tall was the sunflower at the end of week 5?

A graph of Height (cm) (vertical axis, 0 to 40, marked every 10) against Week (horizontal axis, 0 to 8, marked every 1), on a grid with 5 small squares to each large square. The graph is made of straight-line sections; its values can be read from the grid.

Model answer

Each small square is \(10 \div 5 = 2\) cm.
At week 5 the line is 4 small squares above 20: \(20 + 8 = 28\) cm

Explanation

First work out the scale: there are 5 small squares between 20 and 30, so each small square is 2 cm. At week 5 the line is 4 small squares above 20, which is \(20 + 8 = 28\) cm. A common mistake is to count each small square as 1 cm.

Mark scheme
  1. 1 mark

    28 cm

    The unit is not needed. Do not accept 24 or 24.8 (counting each small square as 1 cm).

Question 2

2 marks

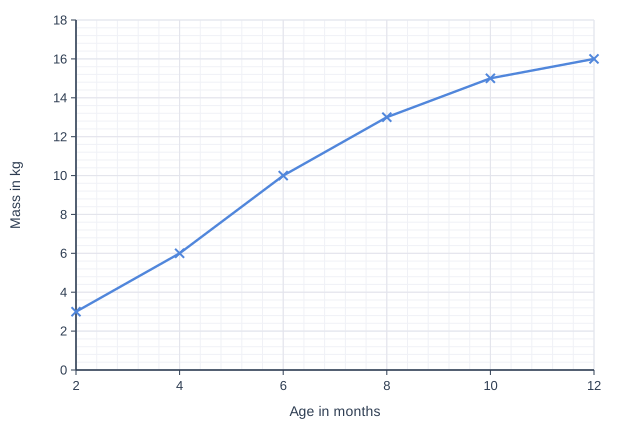
The line graph shows the mass of a puppy as it grew.

How much heavier was the puppy at 8 months than at 2 months?

Line graph of mass in kg (y-axis, 0 to 18) against age in months (x-axis, 2 to 12). The line joins the points (2, 3), (4, 6), (6, 10), (8, 13), (10, 15), (12, 16).

Model answer

2 months: 3 kg
8 months: 13 kg (halfway between 12 and 14)
\(13 - 3 = 10\) kg heavier

Explanation

Read the mass at each age: the scale goes up in 2s, so a point halfway between 12 and 14 is 13 kg. 'How much heavier' means find the difference: \(13 - 3 = 10\) kg. A common mistake is to read a mass from the wrong age on the axis, which goes up in 2 months at a time.

Mark scheme
  1. 1 mark

    Both masses read correctly: 3 kg at 2 months and 13 kg at 8 months; or the correct answer 10 kg with no working

  2. 1 mark

    10 kg

    Follow through from their two readings. The unit is not needed. A correct answer with no working scores full marks.

Question 3

2 marks

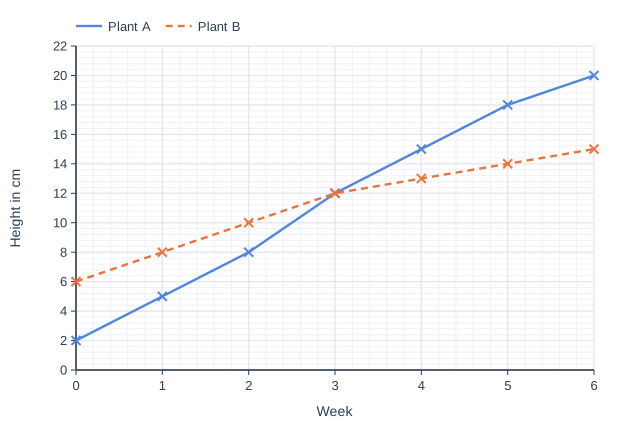
Lucy grew two plants, A and B. She measured their heights at the end of each week. The line graph shows her results.

At the end of which week were the two plants the same height? How much taller was plant A than plant B at the end of week 6?

Line graph of height in cm (y-axis, 0 to 22) against week (x-axis, 0 to 6). "Plant A" joins the points (0, 2), (1, 5), (2, 8), (3, 12), (4, 15), (5, 18), (6, 20). "Plant B" (dashed) joins the points (0, 6), (1, 8), (2, 10), (3, 12), (4, 13), (5, 14), (6, 15).

Model answer

The two lines meet at week 3, where both plants are 12 cm.
Week 6: A is 20 cm and B is 15 cm.
\(20 - 15 = 5\) cm taller

Explanation

The plants are the same height where the two lines cross, which is at week 3. At week 6, read both lines: plant A is 20 cm and plant B is 15 cm (halfway between 14 and 16). The difference is 5 cm. Use the key to check which line belongs to which plant.

Mark scheme
  1. 1 mark

    Week 3

    Accept 3.

  2. 1 mark

    5 cm

    From \(20 - 15\). The unit is not needed. This mark can be awarded on its own.

Question 4

4 marks

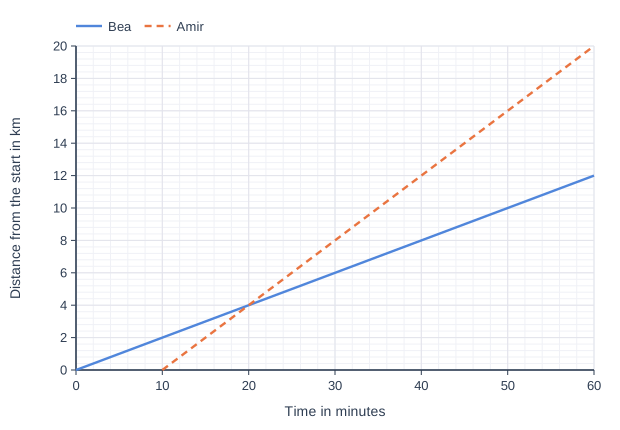
Amir and Bea cycled the same route in a sponsored bike ride. Bea started first. Amir started 10 minutes later. The graph shows their rides. The time is measured from when Bea started.

At what time on the graph did Amir catch up with Bea, and how far had they each cycled then? When Amir finished the ride, how far behind him was Bea?

Line graph of distance from the start in km (y-axis, 0 to 20) against time in minutes (x-axis, 0 to 60). "Bea" joins the points (0, 0), (60, 12). "Amir" (dashed) joins the points (10, 0), (60, 20).

Model answer

The lines cross at 20 minutes and 4 km, so Amir caught up after 20 minutes, when they had each cycled 4 km.
Amir finished at 60 minutes, 20 km from the start.
Bea was at 12 km at 60 minutes.
\(20 - 12 = 8\) km behind

Explanation

Amir catches up with Bea where the two lines cross: at 20 minutes, when both are 4 km from the start. Amir's line is steeper, so he was cycling faster. When Amir finished at 60 minutes he had cycled 20 km, and Bea's line shows 12 km at that time, so she was 8 km behind. Always read both lines at the same time.

Mark scheme
  1. 1 mark

    20 minutes

    Also accept 'when Amir had been cycling for 10 minutes'.

  2. 1 mark

    4 km

    This mark can be awarded on its own.

  3. 1 mark

    At 60 minutes, Amir had cycled 20 km and Bea had cycled 12 km; or the correct answer 8 km with no working

  4. 1 mark

    8 km

    Follow through: 20 minus their reading for Bea at 60 minutes. The unit is not needed. A correct answer with no working scores full marks.

Ready to try the rest? Tap your answers and see straight away how you did.

Topic notes

Line graphs

The big idea

A line graph shows how something changes, usually over time: the temperature during a day, the height of a growing plant or how far someone has travelled. The measurements are plotted as points and joined with straight lines, so you can see at a glance when the value goes up, goes down or stays the same.

Reading a line graph

  1. Read the axis labels and the units, so you know what each axis shows.
  2. Work out the scale on each axis: what each numbered line, and each small square, is worth.
  3. To read the value at a certain time, start at that time on the time axis, rise to meet the line, then move across and read the value.
  4. To find when something had a value, do the opposite: move across from the value to the line, then drop down and read the time.

To find a change between two times, read both values and find the difference. If one value is below 0, count through 0: from \(-4\) up to 5 is 9 degrees, not 1.

The steepness of the line shows how fast the value changes. A steep part means a fast change. A flat part means no change at all: on a journey graph, it means the traveller has stopped.

The points are the real measurements. The lines between them let you estimate values in between.

To fill in a table from a graph, read the values one at a time. To check a graph against its table, check each point in turn: a point that does not match its value in the table has been plotted wrongly.

The graph shows the length of a tree's shadow on a sunny day. How much shorter was the shadow at 11:00 than at 08:00? At what time was it shortest?

A graph of Length of shadow (m) (vertical axis, 0 to 14, marked every 2) against Time (24-hour clock) (horizontal axis, 8 to 16, marked every 1), on a grid with 2 small squares to each large square. The graph is made of straight-line sections joining (8, 12), (9, 8), (10, 6), (11, 4), (12, 3), (13, 2), (14, 3), (15, 4) and (16, 6). (Gradients of the sections from left to right: −4, −2, −2, −1, −1, 1, 1, 2. Area between the graph and the time axis from 8 to 16: 39 (in length of shadow (m) × time (24-hour clock) units; for a velocity-time graph this is the distance travelled).) A cross is marked at (8, 12). A cross is marked at (9, 8). A cross is marked at (10, 6). A cross is marked at (11, 4). A cross is marked at (12, 3). A cross is marked at (13, 2). A cross is marked at (14, 3). A cross is marked at (15, 4). A cross is marked at (16, 6).
The crosses are the measurements, taken every hour. Each numbered line is 2 m more than the one below, so each small square on the length axis is 1 m.

At 08:00, rise to the line and read across: the shadow was 12 m. At 11:00 it was 4 m.

The change is \(12 - 4 = 8\), so the shadow was 8 m shorter.

The line dips lowest above 13:00, so the shadow was shortest at 13:00, when it was 2 m long.

Use the same graph. At what times was the shadow 5 m long?

Go across from 5 m on the length axis. The line crosses 5 m twice: once while the shadow is shrinking and once while it is growing.

Morning: 5 m is halfway between 6 m (10:00) and 4 m (11:00). Drop down from the line to halfway between 10:00 and 11:00: about 10:30.

Afternoon: 5 m is halfway between 4 m (15:00) and 6 m (16:00), so about 15:30.

Nobody measured the shadow at 10:30 or 15:30. Both readings come from the lines between the crosses, so they are estimates.

Conversion graphs

A conversion graph changes an amount from one unit to another, such as miles and kilometres, or pounds and euros. It is a straight line starting at 0. Find the amount you know on its own axis, go to the line, then across or down to the other axis.

The graph converts between cups and millilitres (ml) for a set of measuring cups. A jug holds 1.5 litres. How many cups of water will fill it? How many millilitres are in 3 cups?

A graph of Millilitres (ml) (vertical axis, 0 to 2000, marked every 250) against Cups (horizontal axis, 0 to 8, marked every 1), on a grid. The graph is a straight line joining (0, 0) and (8, 2000). (Gradients of the sections from left to right: 250.)
The line starts at 0, because 0 cups hold 0 ml.

The axis is in millilitres, so change the litres first: 1 litre = 1,000 ml, so 1.5 litres = 1,500 ml.

Go across from 1,500 ml until you meet the line, and drop down to read 6 cups. That is how many fill the jug.

Go up from 3 cups to the line, then across: 750 ml.

Common mistakes

  • Starting on the wrong axis. Begin on the axis of the amount you already know.
  • Taking every small square to be worth 1. Work out the scale first.
  • Giving a reading when the question asks for a change. "How much did it rise?" needs a difference.
  • Giving the value when the question asks "when?", or the time when it asks "how much?".

Top tip

Use a ruler to go straight up and straight across. Write each reading on the graph before you start to calculate.

Study Helper Hints first, answers after you try

Stuck on this one? Ask for a hint and I’ll point you in the right direction, without giving the answer away. Once you’ve checked your answer, I’ll show you how the marks are awarded.