Level:
Correct: 0
Incorrect: 0
Marks: 0/0
Practice
Course:
Topics:
Year 6 Maths Smart practice A mixed round aimed at your weak spots
Unit 1
Place value
Number and place value
Numbers up to ten million
Quick practice5 skills
Rounding whole numbers
Quick practice5 skills
Negative numbers
Quick practice5 skills
Roman numerals
Quick practice4 skills
Unit 2
Calculating
Unit 3
Fractions
Unit 4
Decimals
Unit 5
Fractions, decimals and percentages
Unit 6
Ratio and proportion
Unit 7
Algebra
Unit 8
Measurement
Unit 9
Shapes and angles
Unit 10
Position and direction
Geometry: position and direction
Coordinates in four quadrants
Quick practice5 skills
Translations
Quick practice4 skills
Reflections
Quick practice4 skills
Unit 11
Statistics
Avg
score:
–
Topics
done:
0/60

Pie charts

Practise 22 questions on Pie charts for Year 6 Maths. Tap your answer and find out straight away if you are right, with the Study Helper on hand if you get stuck.

  • 22 questions
  • 1–5 marks each
  • Instant marking
  • No sign-up needed
20 questions, marked as you go

Sample questions with model answers

Here are 4 of the questions in this topic, each with a model answer, an explanation of why it earns the marks and the mark scheme.

Question 1

1 mark

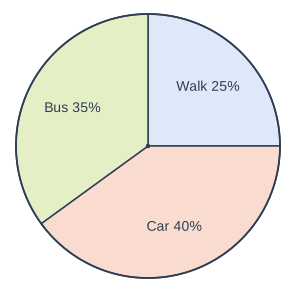
There are 200 pupils at Hillside School. The pie chart shows how they travel to school.

How many pupils walk to school?

Pie chart. A circle divided into sectors, drawn clockwise from the top (12 o'clock): Walk 25%, 90°; Car 40%, 144°; Bus 35%, 126°. (Angles are not printed on the chart; these are the drawn sizes, which can be measured with a protractor.)

Model answer

25% is a quarter.
\(200 \div 4 = 50\) pupils

Explanation

The percentages in a pie chart add up to 100%, which stands for all 200 pupils. 25% is the same as \(\dfrac{1}{4}\), so a quarter of the pupils walk: \(200 \div 4 = 50\). A common mistake is to give the percentage, 25, as the number of pupils.

Mark scheme
  1. 1 mark

    50

    25% of 200. Do not accept 25.

Question 2

2 marks

Ruby asked 18 children to choose their favourite colour.

Red: 10 children
Blue: 5 children
Green: 3 children

She draws a pie chart of the results.

Work out the angle for blue.

Model answer

\(360 \div 18 = 20^\circ\) for each child
Blue: \(5 \times 20 = 100^\circ\)

Explanation

First share \(360^\circ\) between the 18 children: each child gets \(20^\circ\). Then multiply by the number of children who chose blue: \(5 \times 20 = 100^\circ\). You can check all three angles add up to 360: \(200 + 100 + 60 = 360\).

Mark scheme
  1. 1 mark

    \(360 \div 18 = 20^\circ\) for each child; or the correct answer \(100^\circ\) with no working

    Or \(\dfrac{5}{18} \times 360\).

  2. 1 mark

    \(100^\circ\)

    Accept 100. A correct answer with no working scores full marks.

Question 3

2 marks

Leo draws a pie chart with three sectors. He uses angles of \(100^\circ\), \(120^\circ\) and \(150^\circ\).

Why must Leo's pie chart be wrong? What do his angles add up to, and what must the angles in a pie chart add up to?

Model answer

\(100 + 120 + 150 = 370^\circ\)
The angles in a pie chart must add up to \(360^\circ\), so Leo's angles are \(10^\circ\) too big altogether.

Explanation

The sectors of a pie chart fit together to make a whole circle, so their angles must add up to exactly \(360^\circ\). Leo's angles add up to \(370^\circ\), which is more than a full turn, so at least one of them must be wrong. Always check that your angles add up to 360 before you draw a pie chart.

Mark scheme
  1. 1 mark

    A relevant but incomplete reason, e.g. 'the angles in a pie chart must add up to 360' without checking Leo's total, or 'his angles add up to 370' without saying what they should be

  2. 1 mark

    A complete correct reason: his angles add up to \(370^\circ\), but the angles in a pie chart must add up to \(360^\circ\) (a full turn)

    A complete correct reason on its own scores both marks. Accept 'they add up to 10 more than 360'.

Question 4

4 marks

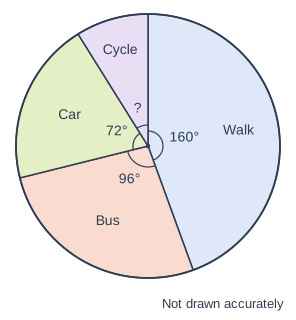
Ella drew a pie chart to show how 45 pupils travel to school. She did not write the angle for Cycle.

How many pupils cycle to school?

Pie chart. A circle divided into sectors, drawn clockwise from the top (12 o'clock): Walk, 160° (printed); Bus, 96° (printed); Car, 72° (printed); Cycle, with its angle marked ?. Each printed angle is marked with a small arc at the centre. It is marked "Not drawn accurately".

Model answer

Each pupil: \(360 \div 45 = 8^\circ\)
Cycle angle: \(360 - 160 - 96 - 72 = 32^\circ\)
\(32 \div 8 = 4\) pupils cycle.

Explanation

First find the missing angle: the four angles add up to \(360^\circ\), so cycle is \(360 - 328 = 32^\circ\). Each pupil is \(360 \div 45 = 8^\circ\), so \(32^\circ\) is 4 pupils. Another way is to find the number of pupils in each of the other sectors (20, 12 and 9) and take their total away from 45. Both ways give 4.

Mark scheme
  1. 1 mark

    \(360 \div 45 = 8^\circ\) for each pupil; or the correct answer 4 with no working

  2. 1 mark

    The cycle angle is \(32^\circ\) (\(360 - 160 - 96 - 72\))

  3. 1 mark

    A correct method for the number of pupils, e.g. \(32 \div 8\)

    Follow through from their angles. Or finds Walk 20, Bus 12, Car 9 and works out \(45 - 41\).

  4. 1 mark

    4

    A correct answer with no working scores full marks.

Ready to try the rest? Tap your answers and see straight away how you did.

Topic notes

Pie charts

The big idea

A pie chart is a circle cut into slices called sectors. The whole circle stands for everything in the data, and each sector shows what fraction of the whole is in one group. Pie charts are good for comparing each group with the whole.

Angles, fractions and percentages

Together, the angles at the centre fill a complete turn: 360°. The size of a sector's angle tells you its fraction of the whole.

AngleFraction of the pie chart
180° (a straight line)\(\dfrac{1}{2}\)
120°\(\dfrac{1}{3}\)
90° (a right angle)\(\dfrac{1}{4}\)
60°\(\dfrac{1}{6}\)
36°\(\dfrac{1}{10}\)

The whole circle is also 100%, so 50% is 180°, 25% is 90° and 10% is 36°.

Reading a pie chart

To find how many are in a group, find its fraction of the circle, then take that fraction of the total. If a pie chart shows 48 children and a sector is a quarter, it stands for 12 children.

When the fraction is not an easy one, find the angle for one: share 360° by the total. For 120 people, each person gets \(360 \div 120 = 3°\). A sector of 60° then stands for 20 people.

This pie chart gives the favourite holiday activity of 120 people. What percentage chose hiking? How many people is that?

Pie chart. A circle divided into sectors, drawn clockwise from the top (12 o'clock): Beach, 150° (printed); Hiking, 54° (printed); Museum, 90° (printed); Theme park, 66° (printed). Each printed angle is marked with a small arc at the centre. (Beach: angle 150°; Hiking: angle 54°; Museum: angle 90°; Theme park: angle 66°.)
Four sectors: 150° + 54° + 90° + 66° = 360°, a full turn.

36° is 10% of the circle, so 18° is 5%. Hiking has \(36° + 18° = 54°\), so it is \(10\% + 5\% = 15\%\).

15% of 120: 10% of 120 is 12 and 5% is 6, so 15% is \(12 + 6 = 18\) people.

Check with the angle for one person: \(360 \div 120 = 3°\), and \(54 \div 3 = 18\). Both ways give 18 people.

Working out the angles

To draw a pie chart, you first work out each angle.

  1. Find what each item is worth in degrees: 360° shared by the total (or 3.6° for each 1%).
  2. Multiply to find the angle for each group.
  3. Add up your angles: the total must be 360°.

In a class survey, 55% chose apples, 25% bananas, 15% grapes and 5% kiwi fruit. Find the size of each sector's angle.

Use 10% of 360° = 36°, and 5% = 18°.

Apples, 55%: 50% is 180°, plus 5% is 18°, so 198°.

Bananas, 25%: a quarter of the circle, 90°.

Grapes, 15%: \(36° + 18° = 54°\). Kiwi fruit, 5%: 18°.

Check: \(198 + 90 + 54 + 18 = 360\). That is a full turn, so the angles fit.

Comparing two pie charts

Each sector stands for a fraction of its own pie chart's total, not a fixed number of people. Two pie charts can only be compared by sector size when they stand for the same total. Otherwise, work out the actual numbers.

A café sold 400 drinks on Saturday and 300 drinks on Sunday. The two pie charts below show which drinks were sold. On which day did the café sell more cups of tea?

Two pie charts side by side, labelled "Saturday: 400 drinks" (left) and "Sunday: 300 drinks" (right). "Saturday: 400 drinks": A circle divided into sectors, drawn clockwise from the top (12 o'clock): Tea, 90° (printed); Coffee, 162° (printed); Juice, 108° (printed). Each printed angle is marked with a small arc at the centre. "Sunday: 300 drinks": A circle divided into sectors, drawn clockwise from the top (12 o'clock): Tea, 120° (printed); Coffee, 144° (printed); Juice, 96° (printed). Each printed angle is marked with a small arc at the centre. (Saturday: 400 drinks: Tea: frequency 100, angle 90°; Coffee: frequency 180, angle 162°; Juice: frequency 120, angle 108°; total 400, so each 1 is 0.9°. Sunday: 300 drinks: Tea: frequency 100, angle 120°; Coffee: frequency 120, angle 144°; Juice: frequency 80, angle 96°; total 300, so each 1 is 1.2°.)
The Tea sector is bigger on Sunday, but the two charts stand for different totals.

Saturday: the Tea angle is 90°, which is \(\dfrac{1}{4}\). A quarter of 400 is 100 cups of tea.

Sunday: the Tea angle is 120°, which is \(\dfrac{1}{3}\). A third of 300 is 100 cups of tea.

Neither: the café sold the same number, 100 cups of tea, on each day, even though the sectors are different sizes.

Common mistakes

  • Reading an angle as a number of people. A 90° sector does not mean 90 people.
  • Thinking a bigger sector always means more people. That is only true when the totals are the same.
  • Sharing the total by 360 instead of sharing 360 by the total.
  • Forgetting to add up your angles to make sure they total 360°.

Top tip

Look for easy fractions first. A sector with a right angle at the centre is a quarter of the chart, and a straight line through the centre cuts it in half. Many pie chart questions need nothing harder.

Study Helper Hints first, answers after you try

Stuck on this one? Ask for a hint and I’ll point you in the right direction, without giving the answer away. Once you’ve checked your answer, I’ll show you how the marks are awarded.