Question 1
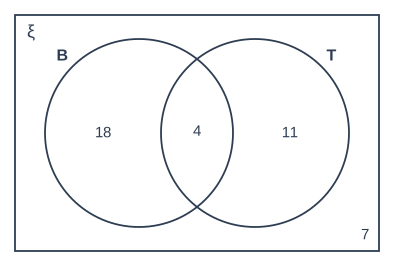
1 markThe Venn diagram shows information about how some students travelled to school last week.
B = students who travelled by bus
T = students who travelled by train
Every student in the survey is shown in the Venn diagram.
How many students were in the survey?
Model answer
18 + 4 + 11 + 7 = 40 students
Explanation
Add the numbers in every region, including the number outside both circles: those 7 students travelled by neither bus nor train, but they were still in the survey. Each student is counted in exactly one region, so the overlap is only added once.
Mark scheme
-
1 mark
B1 for 40
cao