
Level:
Correct: 0
Incorrect: 0
Marks: 0/0
Exam Practice
Course:
Topics:
Edexcel GCSE Maths (Foundation calculator) Smart practice A mixed round aimed at your weak spots
Unit 1
Number
Unit 2
Algebra
Unit 3
Ratio, proportion and rates of change
Unit 4
Geometry and measures
Unit 5
Probability
Unit 6
Statistics
Avg
score:
–
Topics
done:
0/86

Relative frequency and the probability scale

Practise 37 exam-style questions on Relative frequency and the probability scale for Edexcel GCSE Maths (Foundation calculator). Write your answer as you would in the exam and get it marked in seconds against the mark scheme, point by point, with the Study Helper on hand if you get stuck.

  • 37 questions
  • 1–5 marks each
  • Instant marking
  • No sign-up needed
20 questions, marked as you go

Sample questions with model answers

Here are 4 of the questions in this topic, each with a model answer, an explanation of why it earns the marks and the mark scheme an examiner would use.

Question 1

1 mark

The probability of an event is 0.5

Jake says,
"This event is likely to happen."

Is Jake correct?
Give a reason for your answer.

Model answer

No. A probability of 0.5 is evens: the event is equally likely to happen or not happen.

Explanation

On the probability scale, 0.5 is exactly halfway between 0 (impossible) and 1 (certain), so it is described as evens or an even chance. 'Likely' describes probabilities between 0.5 and 1.

Mark scheme
  1. 1 mark

    C1 for No, with a reason, e.g. "0.5 means it is evens - it is just as likely to happen as not to happen"

    do not accept "No" with no reason
Question 2

2 marks

Asha throws a fair coin 10 times.
It lands on heads 7 times.

Asha says,
"The probability of this coin landing on heads is 0.7"

Is Asha correct?
Give a reason for your answer.

Model answer

No. The coin is fair, so the probability of heads is \(\dfrac{1}{2}\) = 0.5
0.7 is the relative frequency from only 10 throws. With so few throws the results can easily be different from 0.5

Explanation

The theoretical probability for a fair coin is 0.5. Relative frequency from an experiment is only an estimate, and with a small number of trials it can be a long way from the true probability. With many more throws the relative frequency would be expected to get close to 0.5.

Mark scheme
  1. 1 mark

    C1 for No, the probability of a fair coin landing on heads is 0.5

    oe, e.g. \(\dfrac{1}{2}\) or evens

  2. 1 mark

    C1 for 0.7 is only the relative frequency from 10 throws, and results vary in a small number of throws

    accept "10 throws is not enough"; do not accept "she might be lying"

Question 3

2 marks

Poppy wants to estimate the probability that her bus is late.
She records her bus on 20 days.
It is late on 4 days and on time on 16 days.

Here is her working.

probability that the bus is late = \(\dfrac{4}{16}\) = 0.25

What mistake has Poppy made?
Work out the correct estimate.

Model answer

Poppy divided by 16, the number of days the bus was on time. She should divide by the total number of days, 20.
Estimate = \(\dfrac{4}{20}\) = 0.2

Explanation

Relative frequency = number of times it happened ÷ total number of trials. The total is all 20 days, not just the days the bus was on time. 4/16 compares late days with on-time days, which is a ratio (1 : 4), not a probability.

Mark scheme
  1. 1 mark

    B1 for she divided by the number of days the bus was on time (16) instead of the total number of days (20)

    oe; correct values with no working score the calculation marks

  2. 1 mark

    B1 for 0.2

    oe, e.g. \(\dfrac{4}{20}\), \(\dfrac{1}{5}\) or 20%

Question 4

3 marks

Ryan makes a spinner with 5 equal sections.
2 of the sections are red, 2 are blue and 1 is yellow.
He spins the spinner 150 times.
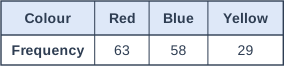
The table shows his results.

Ryan says,
"My spinner is biased."

Is Ryan correct?
You must show how you get your answer.

Table with columns "Colour", "Red", "Blue", "Yellow". Colour: Frequency; Red: 63; Blue: 58; Yellow: 29.

Model answer

For a fair spinner: P(red) = \(\dfrac{2}{5}\), P(blue) = \(\dfrac{2}{5}\), P(yellow) = \(\dfrac{1}{5}\)
Expected: red \(\dfrac{2}{5} \times 150 = 60\), blue 60, yellow \(\dfrac{1}{5} \times 150 = 30\)
Actual: red 63, blue 58, yellow 29
These are all close to the expected numbers, so the spinner does not seem to be biased. Ryan is probably wrong.

Explanation

Work out how many of each colour a fair spinner would give in 150 spins and compare with the results. Small differences are normal because spinning is random. Here every colour is within 3 of the expected number, so there is no evidence of bias.

Mark scheme
  1. 1 mark

    M1 for a theoretical probability, e.g. P(red) = \(\dfrac{2}{5}\) or P(yellow) = \(\dfrac{1}{5}\), or an expected frequency, e.g. \(\dfrac{2}{5} \times 150\) (= 60)

    oe

  2. 1 mark

    A1 for expected frequencies 60, 60 and 30

    or relative frequencies 0.42, 0.386... and 0.193... compared with 0.4, 0.4 and 0.2

  3. 1 mark

    C1 for No, the results are close to what you would expect from a fair spinner

    accept "probably not"; must be supported by correct figures

Ready to try the rest? Every answer you write is marked against the mark scheme, so you can see exactly where the marks are.

Study Helper Hints first, answers after you try

Stuck on this one? Ask for a hint and I’ll point you in the right direction, without giving the answer away. Once you’ve checked your answer, I’ll show you how the marks are awarded.