Level:
Correct: 0
Incorrect: 0
Marks: 0/0
Exam Practice
Course:
Topics:
Edexcel GCSE Maths (Foundation calculator) Smart practice A mixed round aimed at your weak spots
Unit 1
Number
Unit 2
Algebra
Unit 3
Ratio, proportion and rates of change
Unit 4
Geometry and measures
Unit 5
Probability
Unit 6
Statistics
Avg
score:
–
Topics
done:
0/86

Using statistics to describe a population

Practise 19 exam-style questions on Using statistics to describe a population for Edexcel GCSE Maths (Foundation calculator). Write your answer as you would in the exam and get it marked in seconds against the mark scheme, point by point, with the Study Helper on hand if you get stuck.

  • 19 questions
  • 1–5 marks each
  • Instant marking
  • No sign-up needed
19 questions, marked as you go

Sample questions with model answers

Here are 4 of the questions in this topic, each with a model answer, an explanation of why it earns the marks and the mark scheme an examiner would use.

Question 1

1 mark

A head teacher asks a random sample of 40 students how much pocket money they get each week.
The mean amount for the sample is £8.50

There are 900 students in the school.

Write down an estimate for the mean weekly pocket money of all 900 students.

Model answer

£8.50, because the sample mean is the best estimate of the mean for the whole school.

Explanation

A random sample is used to estimate the population, so the sample mean is used as the estimate of the mean for all the students. You do not multiply by 900: that would give an estimate of the total pocket money, not the mean.

Mark scheme
  1. 1 mark

    B1 for £8.50

    cao; do not accept a total such as £7650
Question 2

2 marks

A gym has 600 members.
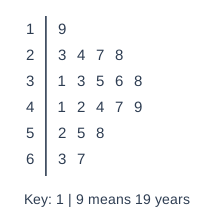
The stem and leaf diagram shows the ages, in years, of a sample of 20 members.

Estimate how many of the 600 members are over 50 years old.

Stem and leaf diagram. Key: 1 | 9 means 19 years. Rows (stem | leaves): 1 | 9; 2 | 3 4 7 8; 3 | 1 3 5 6 8; 4 | 1 2 4 7 9; 5 | 2 5 8; 6 | 3 7.

Model answer

Members in the sample over 50: 52, 55, 58, 63, 67, which is 5 out of 20.
Estimate = \(\dfrac{5}{20}\) × 600 = 150 members

Explanation

Count the ages in the sample that are over 50 (all the leaves on the 5 and 6 stems): there are 5 out of 20, which is a quarter. Assume a quarter of all 600 members are over 50.

Mark scheme
  1. 1 mark

    M1 for \(\dfrac{5}{20} \times 600\) oe

    allow \(\dfrac{4}{20}\) or \(\dfrac{6}{20}\) × 600 (one counting error)

  2. 1 mark

    A1 for 150

    cao; correct answer with no working scores full marks

Question 3

3 marks

A school has 1200 students.
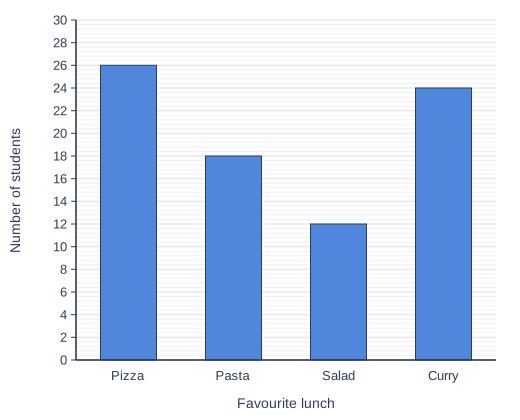
A sample of 80 students were asked to choose their favourite school lunch.
The bar chart shows the results.

The cook plans to make 250 pasta meals for the whole school.

Use the bar chart to decide whether 250 pasta meals is likely to be enough.
You must show how you get your answer.

Bar chart of number of students for each favourite lunch: Pizza 26, Pasta 18, Salad 12, Curry 24.

Model answer

Pasta in the sample = 18 out of 80
Estimate for the school = \(\dfrac{18}{80}\) × 1200 = 270
270 is more than 250, so 250 pasta meals is not likely to be enough.

Explanation

Read the pasta bar (18) and use the fraction of the sample, 18 out of 80, to estimate how many of the 1200 students would choose pasta. The estimate of 270 is more than 250, so the cook should make more. It is still only an estimate, as the sample may not match the whole school exactly.

Mark scheme
  1. 1 mark

    P1 for \(\dfrac{18}{80}\) (= 0.225) oe

    or 1200 ÷ 80 (= 15)

  2. 1 mark

    P1 for \(\dfrac{18}{80} \times 1200\) (= 270) oe

    or 18 × 15

  3. 1 mark

    C1 for No, with an estimate of 270 pasta meals (more than 250)

    answer only scores 0

Question 4

4 marks

A factory makes a batch of 5000 light bulbs.
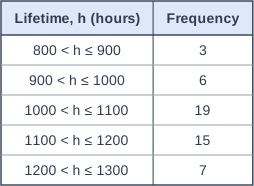
The table shows information about the lifetimes, h hours, of a sample of 50 bulbs from the batch.

The factory claims that more than 80% of its bulbs last more than 1000 hours.

Does the sample support the claim? You must show your working.
Estimate how many bulbs in the batch of 5000 last more than 1000 hours.

Table with columns "Lifetime, h (hours)", "Frequency". Lifetime, h (hours): 800 < h ≤ 900; Frequency: 3 | Lifetime, h (hours): 900 < h ≤ 1000; Frequency: 6 | Lifetime, h (hours): 1000 < h ≤ 1100; Frequency: 19 | Lifetime, h (hours): 1100 < h ≤ 1200; Frequency: 15 | Lifetime, h (hours): 1200 < h ≤ 1300; Frequency: 7.

Model answer

Bulbs in the sample lasting more than 1000 hours = 19 + 15 + 7 = 41
\(\dfrac{41}{50}\) × 100 = 82%
82% is more than 80%, so yes, the sample supports the claim.
Estimate for the batch = 0.82 × 5000 = 4100 bulbs

Explanation

More than 1000 hours means the last three classes. Write this as a percentage of the sample and compare it with 80%. To estimate for the whole batch, use the same proportion: 82% of 5000. The sample supports the claim but cannot prove it, because a different sample might give a different result.

Mark scheme
  1. 1 mark

    M1 for 19 + 15 + 7 (= 41)

  2. 1 mark

    M1 for \(\dfrac{41}{50} \times 100\) (= 82%) oe

    or 80% of 50 = 40 compared with 41

  3. 1 mark

    C1 for Yes, with 82% (or 41 out of 50) compared with 80% (or 40)

  4. 1 mark

    B1 for 4100

    ft \(\dfrac{\text{their } 41}{50} \times 5000\)

Ready to try the rest? Every answer you write is marked against the mark scheme, so you can see exactly where the marks are.

Study Helper Hints first, answers after you try

Stuck on this one? Ask for a hint and I’ll point you in the right direction, without giving the answer away. Once you’ve checked your answer, I’ll show you how the marks are awarded.