Practise 28 exam-style questions on Scatter graphs and correlation for Edexcel GCSE Maths (Foundation calculator). Write your answer as you would in the exam and get it marked in seconds against the mark scheme, point by point, with the Study Helper on hand if you get stuck.
28 questions
1–5 marks each
Instant marking
No sign-up needed
20 questions, marked as you go
Sample questions with model answers
Here are 4 of the questions in this topic, each with a model answer, an explanation of why it earns the marks and the mark scheme an examiner would use.
Question 1
1 mark
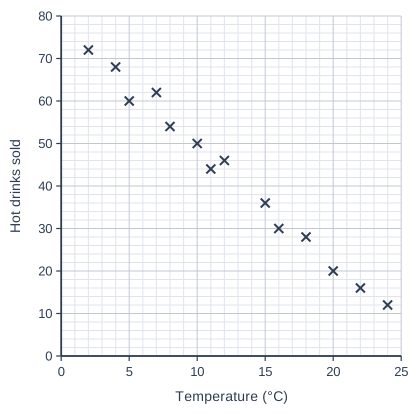
The scatter graph shows the midday temperature and the number of hot drinks sold at a café on 14 days.
On one of these days the midday temperature was 10°C. How many hot drinks were sold on that day?
Model answer
The cross above 10°C is at 50. 50 hot drinks were sold.
Explanation
Each cross shows one day. Find 10°C on the horizontal axis, go up to the cross and read across to the vertical axis. Each small square on the vertical axis is 2 drinks.
Mark scheme
1 mark
B1 for 50
cao
Question 2
2 marks
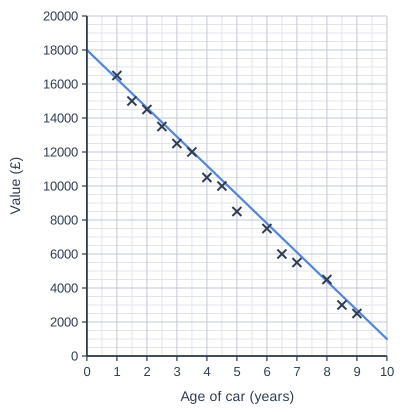
The scatter graph shows the age and the value of 15 cars of the same model. A line of best fit has been drawn.
A car of this model is worth £6000. Use the line of best fit to estimate the age of the car.
Model answer
Go across from £6000 on the value axis to the line of best fit, then down to the age axis. Estimated age = 7 years
Explanation
This time you know the value, so start on the vertical axis at £6000, go across to the line and then down to read the age. Starting from the correct axis is the key step.
Mark scheme
1 mark
M1 for using the line of best fit at £6000
e.g. reading across from £6000 to the line and down
1 mark
A1 for an answer in the range 6.5 to 7.5 years
the line gives 7.06 years; correct answer with no working scores full marks
Question 3
2 marks
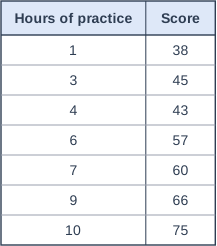
The table shows the number of hours seven people practised darts in one week and their score in a darts competition at the end of the week.
Does the data show positive correlation, negative correlation or no correlation? Give a reason for your answer.
Model answer
Positive correlation. In general, the people who practised for more hours got higher scores (the scores mostly increase as the hours increase).
Explanation
You do not need a graph to spot correlation: look at whether one column tends to increase as the other increases. Here the scores go up as the hours go up (with one small dip from 45 to 43), so the correlation is positive.
Mark scheme
1 mark
B1 for positive
1 mark
C1 for a correct reason, e.g. in general, the more hours a person practised, the higher their score
accept 'as the hours increase, the scores increase' oe
Question 4
4 marks
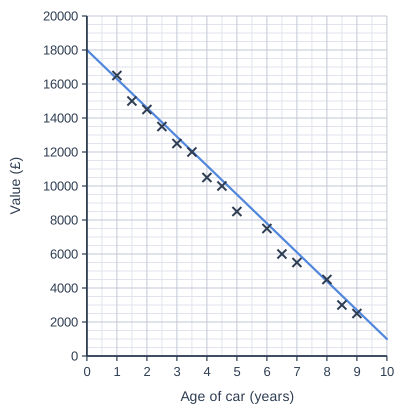
The scatter graph shows the age and the value of 15 cars of the same model. A line of best fit has been drawn.
Use the line of best fit to estimate the percentage decrease in the value of a car of this model between the ages of 2 years and 6 years.
Model answer
From the line: value at 2 years = £14 600, value at 6 years = £7800 Decrease = 14 600 − 7800 = £6800 Percentage decrease = 6800 ÷ 14 600 × 100 = 46.57...% About 47%
Explanation
Read both values from the line of best fit, then use percentage decrease = decrease ÷ original value × 100. The original value is the value at 2 years, so divide by that. A common mistake is to divide by the smaller value.
Mark scheme
1 mark
B1 for a value at 2 years in the range £14 100 to £15 100
the line gives £14 600; correct answer with no working scores full marks
1 mark
B1 for a value at 6 years in the range £7300 to £8300
the line gives £7800
1 mark
M1 for (their value at 2 years − their value at 6 years) ÷ their value at 2 years × 100
e.g. (14 600 − 7800) ÷ 14 600 × 100, or 7800 ÷ 14 600 × 100 (= 53.4...) and 100 − 53.4...
1 mark
A1 for an answer in the range 44% to 49%
46.6% from the line; ft their readings if both B marks are awarded
Ready to try the rest? Every answer you write is marked against the mark scheme, so you can see exactly where the marks are.
Ctrl + Enter to check
Study HelperHints first, answers after you try
Stuck on this one? Ask for a hint and I’ll point you in the right direction, without giving the answer away. Once you’ve checked your answer, I’ll show you how the marks are awarded.