Practise 18 exam-style questions on Sampling and populations for Edexcel GCSE Maths (Foundation calculator). Write your answer as you would in the exam and get it marked in seconds against the mark scheme, point by point, with the Study Helper on hand if you get stuck.
18 questions
1–5 marks each
Instant marking
No sign-up needed
18 questions, marked as you go
Sample questions with model answers
Here are 4 of the questions in this topic, each with a model answer, an explanation of why it earns the marks and the mark scheme an examiner would use.
Question 1
1 mark
Matt wants to find out how much time the students at his school spend on homework each week. He asks 30 students who are in the school library after school.
Give a reason why Matt's sample may be biased.
Model answer
Students who are in the library after school are probably doing homework, so they are likely to spend more time on homework than a typical student. The sample does not represent the whole school.
Explanation
A sample is biased when some members of the population are more likely to be chosen than others, so the results lean one way. Here the people asked are the ones most likely to do lots of homework. A small sample makes results less reliable, but it does not make them biased.
Mark scheme
1 mark
B1 for a correct reason, e.g. students in the library after school are likely to spend more time on homework than other students
accept 'not all students go to the library' or 'it does not represent all the students' oe; do not accept 'the sample is too small'
Question 2
2 marks
Mo wants to find out how often people in his town use buses. He asks 30 people waiting at the bus station at 8 am on a Monday.
Give two reasons why Mo's sample may be biased.
Model answer
People waiting at a bus station are already using a bus, so they are more likely to use buses often. He only asks people at one time, 8 am on a Monday, so they are mostly people travelling to work or school, not people who travel at other times.
Explanation
A biased sample does not represent the whole population fairly. Choosing people at a bus station picks out bus users, and choosing one time of one day picks out one type of traveller. A better sample would choose people at random from everyone in the town.
Mark scheme
1 mark
B1 for one correct reason, e.g. people at a bus station are more likely to use buses than other people
correct answer with no working scores full marks
1 mark
B1 for a second different correct reason, e.g. he only asks people at one time (people going to work on a weekday), or he only asks people in one place
do not accept 'the sample is too small' as a reason for bias
Question 3
3 marks
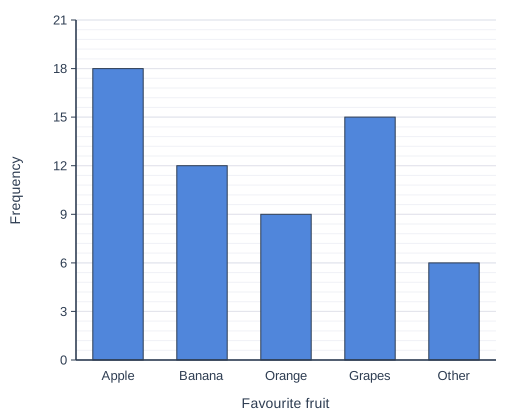
A random sample of people in a town were asked to name their favourite fruit. The bar chart shows the results.
There are 2400 people in the town.
Work out an estimate for the number of people in the town whose favourite fruit is grapes.
Model answer
People in the sample: 18 + 12 + 9 + 15 + 6 = 60 Grapes: 15 out of 60 Estimate: \(\dfrac{15}{60} \times 2400 = 600\) people
Explanation
First add the heights of all the bars to find the size of the sample. The fraction of the sample who chose grapes is an estimate of the fraction of the whole town. Multiply that fraction by 2400.
Mark scheme
1 mark
M1 for 18 + 12 + 9 + 15 + 6 (= 60), the number of people in the sample
1 mark
M1 for \(\dfrac{15}{60} \times 2400\)
ft their total for the sample; oe, e.g. 2400 ÷ 60 = 40 and 40 × 15
1 mark
A1 for 600
cao; correct answer with no working scores full marks
Question 4
4 marks
A factory makes 12 000 phone cases each week. In a random sample of 150 of the cases, 9 are faulty. It costs £2.40 to fix each faulty case.
Work out an estimate for the cost of fixing the faulty cases made in one week.
Use the random sample to estimate the proportion of all the cases that are faulty, then the number of faulty cases in a week. Multiply by the cost of fixing one case. The real cost may be a little different, because the sample is only an estimate.
Mark scheme
1 mark
P1 for \(\dfrac{9}{150}\) (= 0.06)
oe, e.g. 6%
1 mark
P1 for 0.06 × 12 000 (= 720)
the estimated number of faulty cases
1 mark
P1 for 720 × 2.40
ft their number of faulty cases
1 mark
A1 for £1728
accept £1728.00; correct answer with no working scores full marks
Ready to try the rest? Every answer you write is marked against the mark scheme, so you can see exactly where the marks are.
Ctrl + Enter to check
Study HelperHints first, answers after you try
Stuck on this one? Ask for a hint and I’ll point you in the right direction, without giving the answer away. Once you’ve checked your answer, I’ll show you how the marks are awarded.