Level:
Correct: 0
Incorrect: 0
Marks: 0/0
Exam Practice
Course:
Topics:
Edexcel GCSE Maths (Foundation calculator) Smart practice A mixed round aimed at your weak spots
Unit 1
Number
Unit 2
Algebra
Unit 3
Ratio, proportion and rates of change
Unit 4
Geometry and measures
Unit 5
Probability
Unit 6
Statistics
Avg
score:
–
Topics
done:
0/86

Averages and range

Practise 37 exam-style questions on Averages and range for Edexcel GCSE Maths (Foundation calculator). Write your answer as you would in the exam and get it marked in seconds against the mark scheme, point by point, with the Study Helper on hand if you get stuck.

  • 37 questions
  • 1–5 marks each
  • Instant marking
  • No sign-up needed
20 questions, marked as you go

Sample questions with model answers

Here are 4 of the questions in this topic, each with a model answer, an explanation of why it earns the marks and the mark scheme an examiner would use.

Question 1

1 mark

The manager of a shoe shop wants to know which shoe size she should order the most of.

Which average should she use: the mean, the median or the mode?
Give a reason for your answer.

Model answer

The mode, because it tells her which shoe size is bought most often, so it is the size she needs the most of.

Explanation

The mode is the most common value, so it tells the manager which size sells most. The mean could be a size that does not exist, such as 6.37, and the median does not tell her which size is most popular.

Mark scheme
  1. 1 mark

    B1 for mode with a correct reason, e.g. it is the most common (most popular) size

    accept 'the mean may not be a real shoe size' as part of the reason; mode with no reason scores 0
Question 2

2 marks

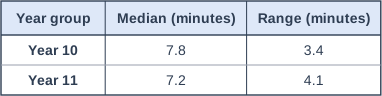
The table shows information about the times, in minutes, that some Year 10 students and some Year 11 students took to run 1500 metres.

Compare the times of the Year 10 students and the Year 11 students.

Table with columns "Year group", "Median (minutes)", "Range (minutes)". Year group: Year 10; Median (minutes): 7.8; Range (minutes): 3.4 | Year group: Year 11; Median (minutes): 7.2; Range (minutes): 4.1.

Model answer

The median for Year 11 (7.2 minutes) is lower than the median for Year 10 (7.8 minutes), so on average the Year 11 students were faster.
The range for Year 10 (3.4 minutes) is smaller than the range for Year 11 (4.1 minutes), so the Year 10 times were more consistent.

Explanation

To compare two distributions, compare an average and a measure of spread, and say what each means in the context. A lower time means faster runners. A smaller range means the times were closer together, so more consistent.

Mark scheme
  1. 1 mark

    C1 for a correct comparison of the medians, e.g. the Year 11 students had a lower median, so on average they were faster

    correct answer with no working scores full marks

  2. 1 mark

    C1 for a correct comparison of the ranges, e.g. the Year 10 students had a smaller range, so their times were more consistent (less spread out)

    at least one comparison must be in context (faster/slower, more/less consistent) for 2 marks; just quoting values with no comparison scores 0

Question 3

3 marks

Kai plays in a bowling league.
He can join the top team if his mean score is more than 150.

Here are his scores in his last six games.

142 167 155 138 160 149

Can Kai join the top team?
You must show your working.

Model answer

Total = 142 + 167 + 155 + 138 + 160 + 149 = 911
Mean = 911 ÷ 6 = 151.83...
151.83... is more than 150, so yes, Kai can join the top team.

Explanation

Add the six scores and divide by 6 to find the mean. Then compare the mean with 150 and write a clear conclusion. Do not round 151.83... down to 150, because the question is whether the mean is more than 150.

Mark scheme
  1. 1 mark

    M1 for (142 + 167 + 155 + 138 + 160 + 149) ÷ 6 or 911 ÷ 6

  2. 1 mark

    A1 for 151.8...

    accept 151.8 or 152 if 151.8... seen or implied; 151.83...

  3. 1 mark

    C1 for Yes, supported by a correct mean of 151.8...

    answer only scores 0

Question 4

4 marks

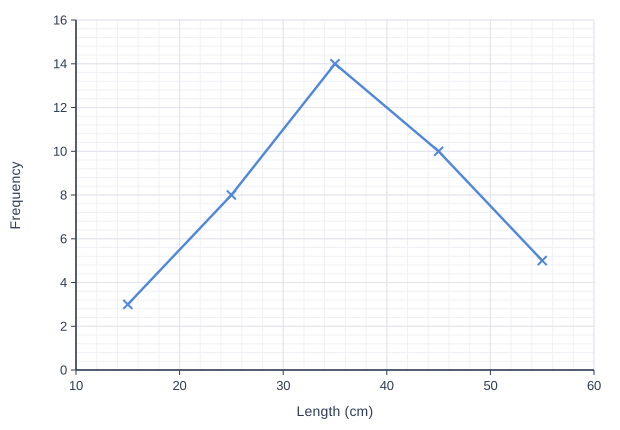
The diagram shows a frequency polygon for the lengths, l cm, of 40 fish caught in a lake.
The classes are 10 < l ≤ 20, 20 < l ≤ 30, and so on.

Work out an estimate for the mean length of the fish.

Line graph of frequency (y-axis, 0 to 16) against length (cm) (x-axis, 10 to 60). The line joins the points (15, 3), (25, 8), (35, 14), (45, 10), (55, 5).

Model answer

From the graph, the frequencies are 3, 8, 14, 10, 5 at the midpoints 15, 25, 35, 45, 55.
Σfx = 15 × 3 + 25 × 8 + 35 × 14 + 45 × 10 + 55 × 5
= 45 + 200 + 490 + 450 + 275 = 1460
Estimate of mean = 1460 ÷ 40 = 36.5 cm

Explanation

The points of a frequency polygon are already at the class midpoints, so read each point's length and frequency. Multiply each midpoint by its frequency, add them up and divide by the total number of fish (40). It is an estimate because the exact lengths are not known.

Mark scheme
  1. 1 mark

    M1 for reading the frequencies 3, 8, 14, 10, 5 from the graph

    allow one error

  2. 1 mark

    M1 for use of f × midpoint, e.g. 15 × 3, 25 × 8, 35 × 14, 45 × 10, 55 × 5 (= 45, 200, 490, 450, 275)

    at least 3 correct products

  3. 1 mark

    M1 for Σfx ÷ 40, e.g. 1460 ÷ 40

  4. 1 mark

    A1 for 36.5 cm

    cao; correct answer with no working scores full marks

Ready to try the rest? Every answer you write is marked against the mark scheme, so you can see exactly where the marks are.

Study Helper Hints first, answers after you try

Stuck on this one? Ask for a hint and I’ll point you in the right direction, without giving the answer away. Once you’ve checked your answer, I’ll show you how the marks are awarded.