Level:
Correct: 0
Incorrect: 0
Marks: 0/0
Exam Practice
Course:
Topics:
Edexcel GCSE Maths (Foundation calculator) Smart practice A mixed round aimed at your weak spots
Unit 1
Number
Unit 2
Algebra
Unit 3
Ratio, proportion and rates of change
Unit 4
Geometry and measures
Unit 5
Probability
Unit 6
Statistics
Avg
score:
–
Topics
done:
0/86

Gradient as a rate of change

Practise 29 exam-style questions on Gradient as a rate of change for Edexcel GCSE Maths (Foundation calculator). Write your answer as you would in the exam and get it marked in seconds against the mark scheme, point by point, with the Study Helper on hand if you get stuck.

  • 29 questions
  • 1–5 marks each
  • Instant marking
  • No sign-up needed
20 questions, marked as you go

Sample questions with model answers

Here are 4 of the questions in this topic, each with a model answer, an explanation of why it earns the marks and the mark scheme an examiner would use.

Question 1

1 mark

The value of a car is shown on a graph of value (£) against age (years).
The graph is a straight line.
The gradient of the line is −1500

What does the gradient of −1500 tell you about the value of the car?

Model answer

The value of the car decreases by £1500 every year.

Explanation

A gradient is the change in the vertical quantity for each 1 unit across. Here that is the change in value (£) for each year. The minus sign means the value is going down, not up.

Mark scheme
  1. 1 mark

    B1 for 'the value of the car goes down by £1500 each year' oe

    both 'decrease' (or 'loses') and 'each year' (or 'per year') are needed
Question 2

2 marks

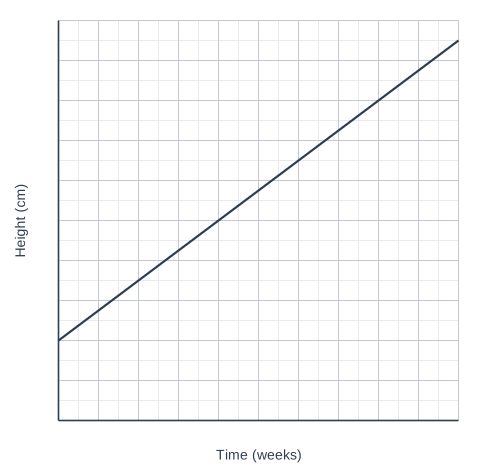
The graph shows the height of a plant over 10 weeks.

Work out the rate at which the plant grows.
Give your answer in cm per week.

A graph of Height (cm) (vertical axis, 0 to 20, marked every 2) against Time (weeks) (horizontal axis, 0 to 10, marked every 1), on a grid with 2 small squares to each large square. The graph is a straight line joining (0, 4) and (10, 19).

Model answer

At 0 weeks the height is 4 cm. At 10 weeks it is 19 cm.
Rate = (19 − 4) ÷ 10 = 15 ÷ 10 = 1.5 cm per week

Explanation

The growth rate is the gradient: the increase in height ÷ the time taken. The plant was already 4 cm tall at the start, so it grew 15 cm, not 19 cm, in 10 weeks.

Mark scheme
  1. 1 mark

    M1 for (19 − 4) ÷ 10 or a correct change in height ÷ change in time from two points on the line

    correct answer with no working scores full marks

  2. 1 mark

    A1 for 1.5 (cm per week)

    cao; do not accept 1.9 (from 19 ÷ 10)

Question 3

3 marks

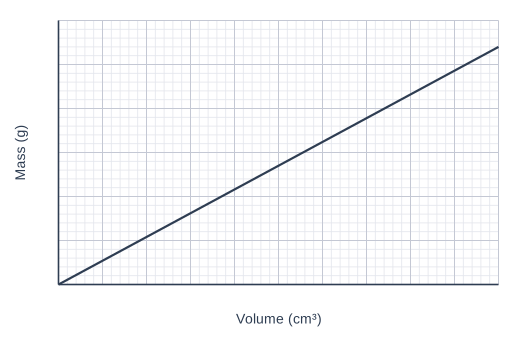
The graph shows the mass and volume of some pieces of aluminium.

Work out the gradient of the line.
What does the gradient represent?

A graph of Mass (g) (vertical axis, 0 to 60, marked every 10) against Volume (cm³) (horizontal axis, 0 to 20, marked every 2), on a grid with 5 small squares to each large square. The graph is a straight line joining (0, 0) and (20, 54).

Model answer

The line passes through (0, 0) and (20, 54).
Gradient = 54 ÷ 20 = 2.7
The gradient is the density of aluminium: 2.7 g/cm³ (the mass of each cm³).

Explanation

The gradient is mass ÷ volume, and mass ÷ volume is density, so the gradient is the density in g/cm³. The line goes through the origin, which shows that the mass is directly proportional to the volume.

Mark scheme
  1. 1 mark

    M1 for a correct change in mass ÷ change in volume from two points on the line, e.g. 54 ÷ 20

    correct answer with no working scores full marks

  2. 1 mark

    A1 for 2.7

    accept 2.6 to 2.8 from a reading of the graph

  3. 1 mark

    C1 for 'the density of aluminium' oe

    accept 'the mass of 1 cm³' or 'grams per cm³'

Question 4

4 marks

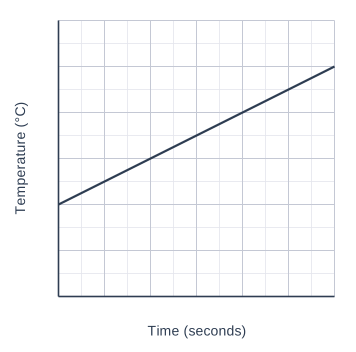
The graph shows the temperature of the water in kettle A for the first 60 seconds after it is switched on.
The temperature keeps rising at the same rate until it reaches 100 °C.

Kettle B heats water that starts at 15 °C.
The temperature in kettle B rises by 0.8 °C every second.

Which kettle heats its water to 100 °C first?
You must show your working.

A graph of Temperature (°C) (vertical axis, 0 to 60, marked every 10) against Time (seconds) (horizontal axis, 0 to 60, marked every 10), on a grid with 2 small squares to each large square. The graph is a straight line joining (0, 20) and (60, 50).

Model answer

Kettle A: the temperature rises from 20 °C to 50 °C in 60 seconds.
Rate = 30 ÷ 60 = 0.5 °C per second
Time to reach 100 °C = (100 − 20) ÷ 0.5 = 160 seconds
Kettle B: time = (100 − 15) ÷ 0.8 = 85 ÷ 0.8 = 106.25 seconds
Kettle B heats its water to 100 °C first.

Explanation

The gradient of the graph is the rate of temperature rise for kettle A. For each kettle, divide the temperature rise needed by the rate to find the time. Remember each kettle starts at a different temperature, so the rise needed is not 100 °C.

Mark scheme
  1. 1 mark

    P1 for the rate for kettle A: (50 − 20) ÷ 60 (= 0.5 °C per second)

    or any correct pair of readings

  2. 1 mark

    P1 for the time for kettle A: (100 − 20) ÷ 0.5 (= 160 seconds)

    ft their rate

  3. 1 mark

    P1 for the time for kettle B: (100 − 15) ÷ 0.8 (= 106.25 seconds)

  4. 1 mark

    C1 for kettle B, supported by 160 s and 106.25 s (or 106 s)

    or for comparing temperatures at the same time, e.g. after 106.25 s kettle A is at 73.1 °C; answer only scores 0

Ready to try the rest? Every answer you write is marked against the mark scheme, so you can see exactly where the marks are.

Study Helper Hints first, answers after you try

Stuck on this one? Ask for a hint and I’ll point you in the right direction, without giving the answer away. Once you’ve checked your answer, I’ll show you how the marks are awarded.