
Level:
Correct: 0
Incorrect: 0
Marks: 0/0
Exam Practice
Course:
Topics:
AQA GCSE Maths (Foundation non-calculator) Smart practice A mixed round aimed at your weak spots
Unit 1
Number
Unit 2
Algebra
Unit 3
Ratio, proportion and rates of change
Unit 4
Geometry and measures
Unit 5
Probability
Unit 6
Statistics
Avg
score:
–
Topics
done:
0/86

Using statistics to describe a population

Practise 18 exam-style questions on Using statistics to describe a population for AQA GCSE Maths (Foundation non-calculator). Write your answer as you would in the exam and get it marked in seconds against the mark scheme, point by point, with the Study Helper on hand if you get stuck.

  • 18 questions
  • 1–5 marks each
  • Instant marking
  • No sign-up needed
18 questions, marked as you go

Sample questions with model answers

Here are 4 of the questions in this topic, each with a model answer, an explanation of why it earns the marks and the mark scheme an examiner would use.

Question 1

1 mark

Sam measures the heights of a random sample of 10 trees in a forest.
The shortest tree in the sample is 4.2 m tall and the tallest is 9.6 m tall.

Sam says,
"No tree in the forest is taller than 9.6 m."

Give a reason why Sam may be wrong.

Model answer

Sam only measured a sample of 10 trees. The forest has many more trees, and some of the trees he did not measure could be taller than 9.6 m.

Explanation

A sample only tells you about the values in the sample. The whole population can have values bigger or smaller than any in the sample, so the range of a sample is not the range of the population.

Mark scheme
  1. 1 mark

    B1 for a correct reason, e.g. he only measured 10 trees, so there may be taller trees in the forest that were not in his sample
Question 2

2 marks

Mo wants to find out how often people in the UK exercise.
He asks 30 people at his local gym.
24 of them say they exercise at least three times a week.

Mo says,
"80% of people in the UK exercise at least three times a week."

Give two reasons why Mo's conclusion may not be reliable.

Model answer

1. The sample is biased: people at a gym are likely to exercise more often than people in general.
2. The sample is too small: 30 people is far too few to describe everyone in the UK.

Explanation

To describe a population from a sample, the sample must be representative and large enough. Asking only people at a gym gives results that are too high, and 30 people from one place cannot represent the whole country.

Mark scheme
  1. 1 mark

    B1 for the sample is biased, e.g. people at a gym are likely to exercise more than other people

    accept "the sample is not representative of the UK" or "he only asked people in one place"

  2. 1 mark

    B1 for the sample is too small, e.g. 30 people is not enough to represent the whole UK

Question 3

3 marks

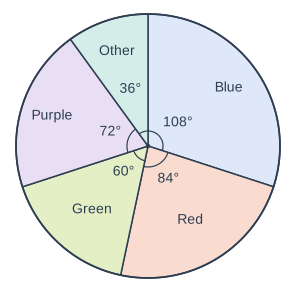
60 students at a school were asked to choose their favourite colour.
The pie chart shows the results.

There are 1200 students at the school.

Estimate how many students at the school would choose blue.

Pie chart. A circle divided into sectors, drawn clockwise from the top (12 o'clock): Blue, 108° (printed); Red, 84° (printed); Green, 60° (printed); Purple, 72° (printed); Other, 36° (printed). Each printed angle is marked with a small arc at the centre.

Model answer

Fraction who chose blue: \(\frac{108}{360} = \frac{3}{10}\)
Estimate: \(\frac{3}{10}\) of 1200 = 360 students

Explanation

The angle gives the fraction of the sample who chose blue: 108° out of 360°, which simplifies to \(\frac{3}{10}\). Assume the same fraction of the whole school would choose blue. You can also find the number in the sample first (18 out of 60) - the fraction is the same.

Mark scheme
  1. 1 mark

    M1 for \(\frac{108}{360}\) oe, or 108 ÷ 6 (= 18 students in the sample)

  2. 1 mark

    M1 for \(\frac{108}{360} \times 1200\) oe, or \(\frac{18}{60} \times 1200\) oe

    ft their 18

  3. 1 mark

    A1 for 360

    correct answer with no working scores full marks

Question 4

4 marks

A farmer has 200 lambs to sell.
She weighs a sample of 10 of the lambs.
Here are their masses, in kilograms.

32   35   30   34   36   31   33   35   32   32

She sells the lambs for £4 per kilogram.

Use the sample to estimate the total amount of money she will get for the 200 lambs.

Model answer

Total mass of the sample: 32 + 35 + 30 + 34 + 36 + 31 + 33 + 35 + 32 + 32 = 330 kg
Mean mass = 330 ÷ 10 = 33 kg
Estimated total mass of 200 lambs = 33 × 200 = 6600 kg
Money = 6600 × £4 = £26 400

Explanation

Use the mean of the sample as an estimate of the mean mass of all the lambs. Multiply by 200 to estimate the total mass, then by £4 for the money. Another way: 200 lambs is 20 times the sample, so the total mass is about 20 × 330 kg.

Mark scheme
  1. 1 mark

    M1 for the total mass of the sample, 330

  2. 1 mark

    M1 for the mean mass, their 330 ÷ 10 (= 33)

  3. 1 mark

    M1 for their 33 × 200 × 4 oe

    e.g. 6600 kg × £4, or 330 × 20 × 4

  4. 1 mark

    A1 for £26 400

    correct answer with no working scores full marks

Ready to try the rest? Every answer you write is marked against the mark scheme, so you can see exactly where the marks are.

Study Helper Hints first, answers after you try

Stuck on this one? Ask for a hint and I’ll point you in the right direction, without giving the answer away. Once you’ve checked your answer, I’ll show you how the marks are awarded.