Level:
Correct: 0
Incorrect: 0
Marks: 0/0
Exam Practice
Course:
Topics:
AQA GCSE Maths (Foundation non-calculator) Smart practice A mixed round aimed at your weak spots
Unit 1
Number
Unit 2
Algebra
Unit 3
Ratio, proportion and rates of change
Unit 4
Geometry and measures
Unit 5
Probability
Unit 6
Statistics
Avg
score:
–
Topics
done:
0/86

Averages and range

Practise 36 exam-style questions on Averages and range for AQA GCSE Maths (Foundation non-calculator). Write your answer as you would in the exam and get it marked in seconds against the mark scheme, point by point, with the Study Helper on hand if you get stuck.

  • 36 questions
  • 1–5 marks each
  • Instant marking
  • No sign-up needed
20 questions, marked as you go

Sample questions with model answers

Here are 4 of the questions in this topic, each with a model answer, an explanation of why it earns the marks and the mark scheme an examiner would use.

Question 1

1 mark

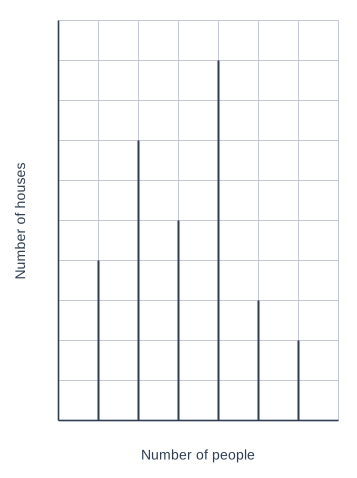
The vertical line chart shows the number of people living in each house on a street.

Write down the modal number of people.
A graph of Number of houses (vertical axis, 0 to 10, marked every 1) against Number of people (horizontal axis, 0 to 7, marked every 1), on a grid. A straight line segment joins (1, 0) to (1, 4). A straight line segment joins (2, 0) to (2, 7). A straight line segment joins (3, 0) to (3, 5). A straight line segment joins (4, 0) to (4, 9). A straight line segment joins (5, 0) to (5, 3). A straight line segment joins (6, 0) to (6, 2).

Model answer

The tallest line is at 4 people (9 houses).
The mode is 4 people.

Explanation

The modal number is the value with the highest frequency, so find the tallest line and read the value underneath it. The answer is 4 people, not 9, because 9 is the number of houses (the frequency).

Mark scheme
  1. 1 mark

    B1 for 4

    do not accept 9

Question 2

2 marks

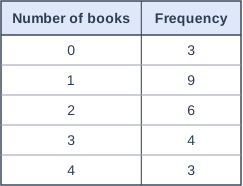
25 students were asked how many books they read last month.
The table shows the results.

Work out the median number of books.

Table with columns "Number of books", "Frequency". Number of books: 0; Frequency: 3 | Number of books: 1; Frequency: 9 | Number of books: 2; Frequency: 6 | Number of books: 3; Frequency: 4 | Number of books: 4; Frequency: 3.

Model answer

There are 25 values, so the median is the (25 + 1) ÷ 2 = 13th value.
Running totals: 0 books: 3, 1 book: 3 + 9 = 12, 2 books: 12 + 6 = 18
The 13th value is in the 2 books row.
Median = 2 books

Explanation

The median is the middle value when all 25 values are in order. The table already lists the values in order, so count down the frequencies until you pass the 13th value. The answer is a number of books, not a frequency.

Mark scheme
  1. 1 mark

    M1 for identifying the 13th value, e.g. (25 + 1) ÷ 2 = 13, or running totals 3, 12, 18

  2. 1 mark

    A1 for 2

    correct answer with no working scores full marks; 13 or 6 scores 0

Question 3

2 marks

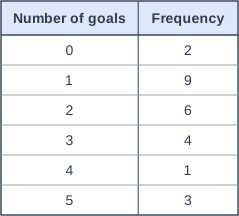
The table shows the number of goals scored by a football team in each of 25 matches.

Max says,
"The range of the number of goals is 9 − 1 = 8."

What mistake has Max made?
Work out the correct range.

Table with columns "Number of goals", "Frequency". Number of goals: 0; Frequency: 2 | Number of goals: 1; Frequency: 9 | Number of goals: 2; Frequency: 6 | Number of goals: 3; Frequency: 4 | Number of goals: 4; Frequency: 1 | Number of goals: 5; Frequency: 3.

Model answer

Max worked out the range of the frequencies, not the range of the numbers of goals.
The most goals scored in a match is 5 and the fewest is 0.
Range = 5 − 0 = 5

Explanation

The frequencies tell you how many matches had each number of goals. The data values are the numbers of goals, from 0 to 5, so the range is 5 − 0. Only use values that actually happened (have a frequency that is not 0).

Mark scheme
  1. 1 mark

    B1 for he used the frequencies (instead of the numbers of goals) oe

  2. 1 mark

    B1 for 5

Question 4

4 marks

Jack and Mia each did 5 long jumps.
Here are their distances, in metres.

Jack:   4.2   3.8   4.5   4.1   3.9
Mia:   4.6   3.5   4.8   3.9   4.2

Compare the distances jumped by Jack and Mia.
You must show your working.

Model answer

Jack: total = 4.2 + 3.8 + 4.5 + 4.1 + 3.9 = 20.5, mean = 20.5 ÷ 5 = 4.1 m, range = 4.5 − 3.8 = 0.7 m
Mia: total = 4.6 + 3.5 + 4.8 + 3.9 + 4.2 = 21.0, mean = 21 ÷ 5 = 4.2 m, range = 4.8 − 3.5 = 1.3 m
On average Mia jumped further, because her mean (4.2 m) is greater than Jack's (4.1 m).
Jack was more consistent, because his range (0.7 m) is smaller than Mia's (1.3 m).

Explanation

Work out an average (the mean or the median) and the range for each person, then make two comparisons: one about the average and one about the spread. Say what each comparison means for the long jumps - further on average, and more consistent - rather than just which number is bigger.

Mark scheme
  1. 1 mark

    M1 for the mean for both, Jack 4.1 and Mia 4.2, or the median for both, Jack 4.1 and Mia 4.2

    allow totals 20.5 and 21 with ÷ 5

  2. 1 mark

    M1 for the range for both, Jack 0.7 and Mia 1.3

  3. 1 mark

    B1 for a correct comparison of the averages in context, e.g. Mia jumped further on average

    ft their averages if M1 awarded

  4. 1 mark

    B1 for a correct comparison of the ranges in context, e.g. Jack was more consistent

    ft their ranges if M1 awarded; answer only scores 0

Ready to try the rest? Every answer you write is marked against the mark scheme, so you can see exactly where the marks are.

Study Helper Hints first, answers after you try

Stuck on this one? Ask for a hint and I’ll point you in the right direction, without giving the answer away. Once you’ve checked your answer, I’ll show you how the marks are awarded.