Practise 28 exam-style questions on Scatter graphs and correlation for AQA GCSE Maths (Foundation non-calculator). Write your answer as you would in the exam and get it marked in seconds against the mark scheme, point by point, with the Study Helper on hand if you get stuck.
28 questions
1–5 marks each
Instant marking
No sign-up needed
20 questions, marked as you go
Sample questions with model answers
Here are 4 of the questions in this topic, each with a model answer, an explanation of why it earns the marks and the mark scheme an examiner would use.
Question 1
1 mark
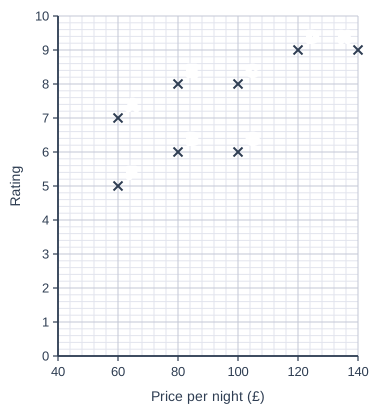
The scatter graph shows the price per night and the customer rating of 8 hotels. Each hotel is shown by a letter.
Which hotel costs £80 per night and has a rating of 6?
Model answer
Go along the price axis to £80 and up to a rating of 6. The point there is B.
Explanation
Each point shows two values: the price is read from the horizontal axis and the rating from the vertical axis. Two hotels cost £80 (B and E) and two have a rating of 6 (B and G), so you must use both values to find the right point.
Mark scheme
1 mark
B1 for B
Question 2
2 marks
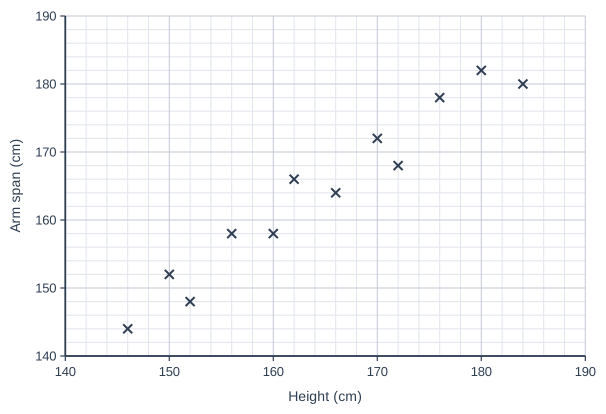
The scatter graph shows the heights and the arm spans of 12 people.
Mia is 174 cm tall.
Use a line of best fit to estimate Mia's arm span.
Model answer
A line of best fit through the middle of the points goes from about (145, 145) to (185, 184). At a height of 174 cm the line is at about 174 cm. Mia's arm span is about 174 cm.
Explanation
A line of best fit is a straight line through the middle of the points, following the trend, with about as many points above it as below. Here the points lie close to a line where arm span is about the same as height. Then read the line at 174 cm.
Mark scheme
2 marks
B2 for an answer in [170, 178] (cm)
B1 for an answer in [166, 182]; correct answer with no working scores full marks
Question 3
2 marks
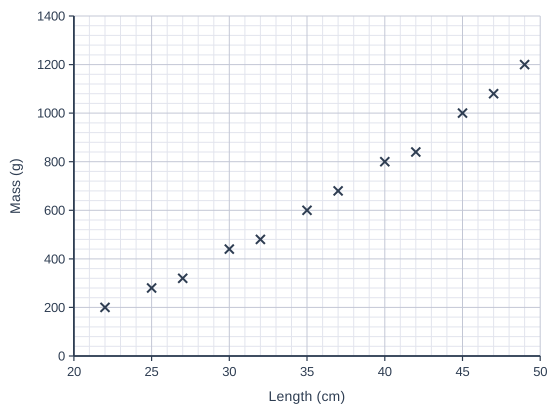
The scatter graph shows the lengths and the masses of 12 fish of the same type.
Ali catches another fish of this type. It is 40 cm long and has a mass of 400 g.
Would this fish be an outlier on the scatter graph? Give a reason for your answer.
Model answer
Yes. The graph shows that a 40 cm fish has a mass of about 800 g. Ali's fish has only half of that mass, so its point would be far below the pattern of the other points.
Explanation
An outlier is a point that does not fit the pattern of the rest of the data. Use the graph to see what mass a 40 cm fish usually has, then compare it with 400 g. A value this far from the trend would be an outlier.
Mark scheme
1 mark
B1 for Yes
1 mark
B1dep for a correct reason, e.g. the fish on the graph that is 40 cm long has a mass of 800 g, so 400 g is much lighter than the trend / the point would be far below the other points
Question 4
4 marks
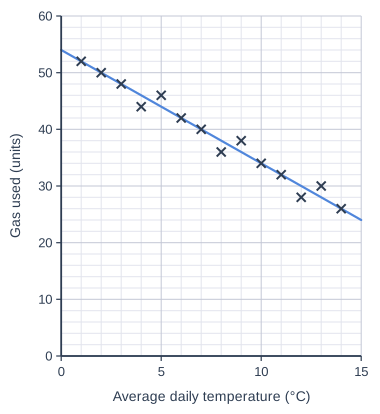
The scatter graph shows the average daily temperature and the amount of gas a house used on 14 days. A line of best fit has been drawn.
Gas costs 8p per unit.
One week, the average daily temperature is 4 °C on every day. Use the line of best fit to estimate the cost of the gas the house uses in this week. Give your answer in pounds.
Model answer
Go up from 4 °C to the line of best fit and across: about 46 units each day. In a week: 46 × 7 = 322 units Cost: 322 × 8p = 2576p = £25.76
Explanation
The line of best fit gives the gas used in one day, so multiply by 7 for the week and then by the price of 8p per unit. Change pence to pounds by dividing by 100. Check that your answer is sensible for a week of gas.
Mark scheme
1 mark
M1 for reading the line of best fit at 4 °C
1 mark
A1 for an answer in [44, 48] (units)
the line gives 46
1 mark
M1 for their reading × 7 × 8 oe
e.g. 46 × 56 = 2576 (p)
1 mark
A1 for an answer in [£24.64, £26.88]
ft their reading in [44, 48] × 0.56; the line gives £25.76; correct answer with no working scores full marks
Ready to try the rest? Every answer you write is marked against the mark scheme, so you can see exactly where the marks are.
Ctrl + Enter to check
Study HelperHints first, answers after you try
Stuck on this one? Ask for a hint and I’ll point you in the right direction, without giving the answer away. Once you’ve checked your answer, I’ll show you how the marks are awarded.