Question 1
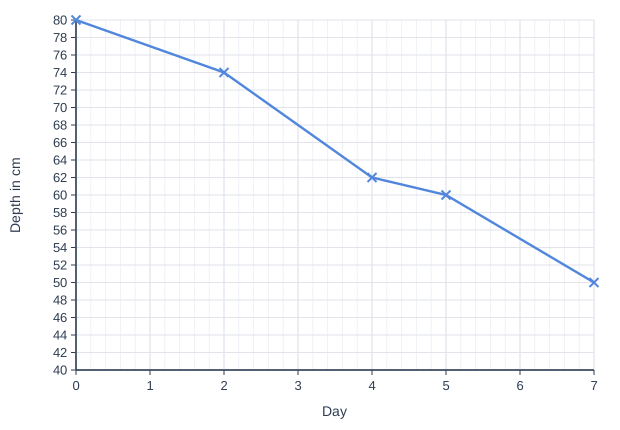
1 markThe graph shows the depth of water in a pond, measured every day for 7 days.
Between which two days did the depth of water fall fastest?
Model answer
Between day 2 and day 4 the line is steepest: the depth falls 74 − 62 = 12 cm in 2 days, which is 6 cm per day.
Between day 2 and day 4
Explanation
The steepest part of the graph shows the fastest rate of change. Do not just look for the biggest drop: compare the drop for each day, because the sections cover different numbers of days. The rates are 3, 6, 2 and 5 cm per day.
Mark scheme
-
1 mark
B1 for between day 2 and day 4
accept 2 and 4