Practise 17 exam-style questions on Levels of organisation for AQA GCSE Combined Science (Biology Paper 2). Write your answer as you would in the exam and get it marked in seconds against the mark scheme, point by point, with the Study Helper on hand if you get stuck.
17 questions
1–6 marks each
Instant marking
No sign-up needed
17 questions, marked as you go
Sample questions with model answers
Here are 4 of the questions in this topic, each with a model answer, an explanation of why it earns the marks and the mark scheme an examiner would use.
Question 1
2 marks
In the food chain grass → rabbit → fox, the fox is described as a predator and the rabbit as its prey.
Explain what is meant by a predator and by prey.
Model answer
A predator is a consumer that kills and eats other animals, like the fox. Prey are the animals that are killed and eaten, like the rabbit.
Explanation
Consumers that kill and eat other animals are predators, and those eaten are prey. An animal can be both: a blue tit is a predator of caterpillars and the prey of a sparrowhawk.
Mark scheme
1 mark
a predator is a consumer that kills and eats other animals
allow an animal that hunts and eats other animals
1 mark
prey are the animals that are killed and eaten (by predators)
Question 2
2 marks
A student recorded the distance along a transect and the number of plants in a quadrat at each point.
Name the type of graph she should use to display her results, and give a reason for your answer.
Model answer
A line graph (or scatter graph), because distance along the transect and number of plants are both numerical, and distance is a continuous variable.
Explanation
Bar charts are used when the independent variable is in categories, such as different habitats. When the independent variable is continuous, such as distance or light intensity, plot the points on a line graph or scatter graph with suitable scales on both axes.
Mark scheme
1 mark
line graph / scatter graph
do not accept bar chart
1 mark
both variables are continuous (numerical) / distance is a continuous variable
Question 3
3 marks
Photosynthetic organisms, such as green plants and algae, are described as the producers of biomass for life on Earth.
Explain why.
Model answer
Green plants and algae make glucose by photosynthesis, using light energy, carbon dioxide and water. They use the glucose to make other substances, such as cellulose, starch and proteins, which form their biomass. Consumers cannot make their own food, so all of them get their biomass by eating producers or by eating other animals that have eaten producers.
Explanation
Every food chain begins with a producer that synthesises molecules. Without photosynthesis there would be no new biomass entering food chains, so producers support every other organism in a community.
Mark scheme
1 mark
they make glucose by photosynthesis (using light energy, carbon dioxide and water)
allow they synthesise molecules / make their own food
1 mark
the glucose is used to make other substances (e.g. cellulose, starch, proteins) that form their biomass
1 mark
all consumers get their biomass by eating producers, or by eating animals that have eaten producers
allow all food chains begin with a producer
Question 4
4 marks
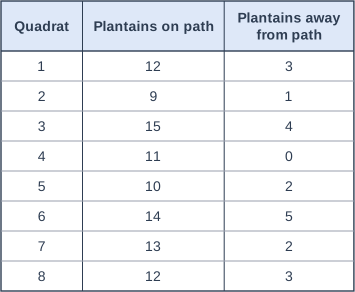
A student investigated whether being trampled affects the distribution of plantains. Plantains have flat leaves that grow close to the ground. She counted plantains in eight random quadrats on a footpath across a field and in eight random quadrats in the long grass away from the path.
The table shows her results.
Calculate the mean number of plantains per quadrat in each area, and suggest an explanation for the difference.
Model answer
Mean on the path = 96 ÷ 8 = 12 plantains per quadrat Mean away from the path = 20 ÷ 8 = 2.5 plantains per quadrat There were nearly five times as many plantains on the path. Plantains have flat leaves close to the ground, so they survive trampling, but taller plants are damaged by it. On the path the plantains have less competition for light and space, whereas in the long grass they are shaded out by taller plants.
Explanation
Comparing random samples from two areas is a way to investigate the effect of a factor on distribution. The explanation links the factor (trampling) to competition between plants for light and space.
Mark scheme
1 mark
on the path: 96 ÷ 8 = 12
1 mark
away from the path: 20 ÷ 8 = 2.5
1 mark
plantains are more common on the path / trampled area
allow about 5 times as many on the path
1 mark
taller plants are damaged by trampling, so plantains (with flat leaves close to the ground) have less competition for light / space on the path
allow in long grass, plantains are shaded out by taller plants
Ready to try the rest? Every answer you write is marked against the mark scheme, so you can see exactly where the marks are.
Ctrl + Enter to check
Study HelperHints first, answers after you try
Stuck on this one? Ask for a hint and I’ll point you in the right direction, without giving the answer away. Once you’ve checked your answer, I’ll show you how the marks are awarded.