Level:
Correct: 0
Incorrect: 0
Marks: 0/0
Exam Practice
Course:
Topics:
Avg
score:
–
Topics
done:
0/35

Control of blood glucose concentration

Practise 18 exam-style questions on Control of blood glucose concentration for AQA GCSE Combined Science (Biology Paper 2). Write your answer as you would in the exam and get it marked in seconds against the mark scheme, point by point, with the Study Helper on hand if you get stuck.

  • 18 questions
  • 1–6 marks each
  • Instant marking
  • No sign-up needed
18 questions, marked as you go

Sample questions with model answers

Here are 4 of the questions in this topic, each with a model answer, an explanation of why it earns the marks and the mark scheme an examiner would use.

Question 1

2 marks

Type 1 diabetes causes uncontrolled high blood glucose levels.

Give the cause of Type 1 diabetes and how it is normally treated.

Model answer

In Type 1 diabetes the pancreas fails to produce enough insulin. It is normally treated with insulin injections.

Explanation

Without enough insulin, glucose is not moved from the blood into cells, so blood glucose rises out of control. Injected insulin replaces the hormone the pancreas cannot make.

Mark scheme
  1. 1 mark

    the pancreas fails to produce sufficient insulin

    allow the pancreas produces little or no insulin; do not accept 'body does not respond to insulin'

  2. 1 mark

    insulin injections

    allow injecting insulin; 'insulin' alone is not enough

Question 2

2 marks

A town has 48 000 adults. 7% of the adults have diabetes. 90% of the adults with diabetes have Type 2 diabetes.

Calculate the number of adults in the town who have Type 2 diabetes.

Model answer

Adults with diabetes = 48 000 × 7 ÷ 100 = 3360
Adults with Type 2 diabetes = 3360 × 90 ÷ 100 = 3024

Explanation

Work out the percentage in two steps: first 7% of all the adults, then 90% of that group. A common mistake is to add the percentages or to take 90% of the whole town.

Mark scheme
  1. 1 mark

    adults with diabetes = 48 000 × 0.07 = 3360

    an answer of 3024 scores 2 marks

  2. 1 mark

    Type 2 = 3360 × 0.9 = 3024

    allow ecf from an incorrect first step

Question 3

3 marks

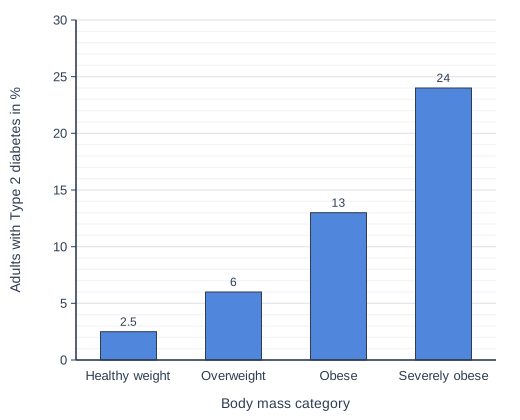
The bar chart shows the percentage of adults in four body mass categories who have Type 2 diabetes.

Describe the relationship shown in the bar chart and explain whether the data prove that obesity causes Type 2 diabetes.

Bar chart of Adults with Type 2 diabetes in % for each body mass category: Healthy weight 2.5, Overweight 6, Obese 13, Severely obese 24.

Model answer

As body mass increases, the percentage of adults with Type 2 diabetes increases. For example, 24% of severely obese adults have Type 2 diabetes compared with 2.5% of adults of a healthy weight, which is about 10 times as many. However, the data only show a correlation. They do not prove that obesity causes Type 2 diabetes, because other factors such as diet, lack of exercise, genes or age could affect both body mass and diabetes.

Explanation

Obesity is a risk factor for Type 2 diabetes, and the data show a strong positive correlation. But a correlation alone does not prove one thing causes another; scientists need evidence of a mechanism or controlled studies to show causation.

Mark scheme
  1. 1 mark

    as body mass increases, the percentage of people with Type 2 diabetes increases

    allow positive correlation

  2. 1 mark

    use of data, e.g. severely obese 24% compared with healthy weight 2.5% / about 10 times as many

    allow any correct comparison of two categories

  3. 1 mark

    does not prove obesity causes diabetes: it shows a correlation only / other factors (e.g. diet, lack of exercise, genes, age) could be involved

Question 4

4 marks

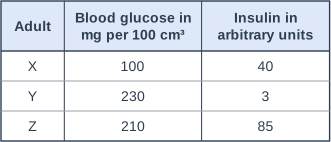
The table shows the blood glucose concentration and the blood insulin concentration of three adults, X, Y and Z, two hours after the same meal. One adult has Type 1 diabetes, one has Type 2 diabetes and one does not have diabetes.

Which adult has Type 1 diabetes and which has Type 2 diabetes? Explain your answers.

Table with columns "Adult", "Blood glucose in mg per 100 cm³", "Insulin in arbitrary units". Adult: X; Blood glucose in mg per 100 cm³: 100; Insulin in arbitrary units: 40 | Adult: Y; Blood glucose in mg per 100 cm³: 230; Insulin in arbitrary units: 3 | Adult: Z; Blood glucose in mg per 100 cm³: 210; Insulin in arbitrary units: 85.

Model answer

Y has Type 1 diabetes. Y's blood glucose concentration is high (230 mg per 100 cm³) but the insulin concentration is very low (3 arbitrary units), which shows the pancreas is not producing enough insulin.
Z has Type 2 diabetes. Z's blood glucose is also high (210 mg per 100 cm³) even though there is plenty of insulin (85 arbitrary units), so Z's body cells are not responding to insulin.

Explanation

Both types of diabetes give high blood glucose, so look at insulin to tell them apart. Low insulin points to Type 1 (the pancreas does not make enough); high insulin with high glucose points to Type 2 (the cells do not respond). X has normal values for both.

Mark scheme
  1. 1 mark

    Y has Type 1 diabetes

  2. 1 mark

    Y has very little insulin (3 units), because the pancreas does not produce enough insulin, so glucose stays high

  3. 1 mark

    Z has Type 2 diabetes

  4. 1 mark

    Z has a high insulin concentration (85 units) but glucose is still high, so the body cells are not responding to insulin

Ready to try the rest? Every answer you write is marked against the mark scheme, so you can see exactly where the marks are.

Revision notes

Control of blood glucose concentration

The big idea

Cells need glucose for respiration, which releases the energy they need. So the concentration of glucose in the blood must not get too high or too low. Blood glucose concentration is monitored and controlled by the pancreas, using hormones. When this control system stops working, a person has diabetes.

How insulin lowers blood glucose

After a meal, carbohydrates are digested into glucose, which is absorbed into the blood, so the blood glucose concentration rises. Then:

  1. The pancreas detects the rise and produces the hormone insulin, which travels in the blood.
  2. Insulin causes glucose to move from the blood into the cells.
  3. In liver and muscle cells, excess glucose is converted to glycogen for storage.
  4. The blood glucose concentration falls back to normal.

Learn these words carefully:

WordWhat it is
GlucoseThe sugar carried in the blood and used in respiration
InsulinThe hormone made by the pancreas when blood glucose is too high
GlycogenThe storage carbohydrate made from glucose in liver and muscle cells

Insulin does not turn into anything itself: it causes cells to take in glucose.

Diabetes

Type 1 diabetesType 2 diabetes
CauseThe pancreas fails to produce sufficient insulinThe body cells no longer respond to the insulin the pancreas produces
Blood glucoseUncontrolled and highHigh
Insulin in the bloodLowNormal or even high
Usual treatmentInsulin injectionsA carbohydrate-controlled diet and an exercise regime
Risk factorNot caused by diet or lifestyleObesity
  • Insulin is injected, not swallowed, because it is a protein: protease enzymes in the gut would digest it. People with Type 1 diabetes check their blood glucose and match their insulin dose to what they eat and how active they are.
  • In Type 2 diabetes, eating less carbohydrate means less glucose enters the blood. Exercise makes muscles respire faster and take more glucose from the blood, and helps with weight loss.
  • Measuring insulin as well as glucose tells the two types apart: high glucose with low insulin suggests Type 1; high glucose with plenty of insulin suggests Type 2.

Reading blood glucose graphs

Line graph of blood glucose concentration in mmol/dm³ (y-axis, 0 to 16) against time after the meal in minutes (x-axis, 0 to 180). "Without diabetes" is a smooth curve through (0, 4.5), (30, 7), (45, 7.5), (60, 7), (90, 5.5), (120, 4.5), (150, 4.5), (180, 4.5). "Untreated diabetes" (dashed) is a smooth curve through (0, 7), (30, 10), (60, 13), (90, 15), (120, 14.5), (150, 13.5), (180, 12.5).
Blood glucose of two people after the same meal containing carbohydrate.

Calculating from a blood glucose graph

Use the graph to calculate the percentage increase from the starting concentration to the peak for each person. Explain the difference.

Without diabetes: \(\dfrac{7.5 - 4.5}{4.5} \times 100 = 66.7\%\)

Untreated diabetes: \(\dfrac{15 - 7}{7} \times 100 = 114\%\)

In the person without diabetes, the pancreas produces insulin as the concentration rises, so glucose moves from the blood into cells, excess glucose is converted to glycogen in the liver and muscles, and the rise stays small. In the person with untreated diabetes, glucose is not moved into cells, because there is not enough insulin or the cells do not respond to it, so the concentration rises much more and stays high.

Higher tier only

Glucagon and negative feedback

If the blood glucose concentration is too low, for example between meals or during exercise, the pancreas produces a second hormone, glucagon. Glucagon causes glycogen to be converted into glucose and released into the blood, so the concentration rises.

Insulin and glucagon interact in a negative feedback cycle:

  • too high → pancreas releases insulin → glucose moves into cells and is stored as glycogen → concentration falls;
  • too low → pancreas releases glucagon → glycogen is converted to glucose and released → concentration rises;
  • as the level returns to normal, less of that hormone is released.

So the two hormones change in opposite directions: after a meal insulin rises and glucagon falls. Watch the spelling: glucagon is the hormone, glycogen is the store, and glucagon is not converted into anything.

Common mistakes

  • Saying insulin "breaks down glucose" or "is converted to glycogen". Insulin causes glucose to move into cells, where excess glucose is converted to glycogen.
  • Saying Type 1 diabetes is caused by eating too much sugar. In Type 1 the pancreas does not produce enough insulin.
  • Saying no insulin is made in Type 2 diabetes. Insulin is made, but the body cells no longer respond to it.
  • Saying the liver monitors blood glucose. The pancreas monitors it; the liver is a target organ.
  • Saying cells need glucose "to make energy". Respiration releases energy.

Exam tip

"Compare" questions on diabetes need contrasts for both types: cause, then treatment linked to the cause. For "how many times more likely" questions, divide one value by the other; do not subtract.

Study Helper Hints first, answers after you try

Stuck on this one? Ask for a hint and I’ll point you in the right direction, without giving the answer away. Once you’ve checked your answer, I’ll show you how the marks are awarded.