Level:
Correct: 0
Incorrect: 0
Marks: 0/0
Exam Practice
Course:
Topics:
Avg
score:
–
Topics
done:
0/35

Global warming

Practise 11 exam-style questions on Global warming for AQA GCSE Combined Science (Biology Paper 2). Write your answer as you would in the exam and get it marked in seconds against the mark scheme, point by point, with the Study Helper on hand if you get stuck.

  • 11 questions
  • 1–6 marks each
  • Instant marking
  • No sign-up needed
11 questions, marked as you go

Sample questions with model answers

Here are 4 of the questions in this topic, each with a model answer, an explanation of why it earns the marks and the mark scheme an examiner would use.

Question 1

2 marks

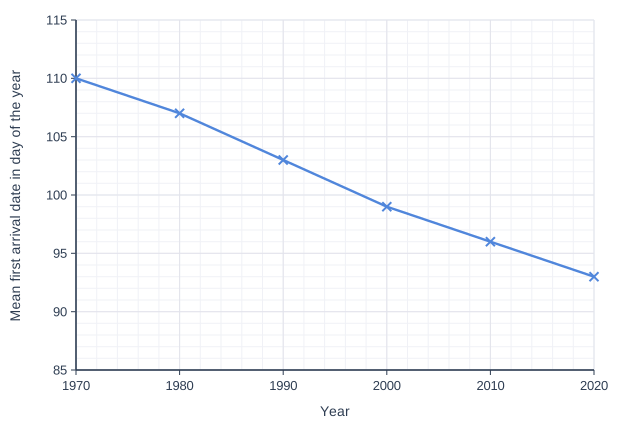
Swallows are birds that spend the winter in Africa and fly to the UK in spring to breed. The graph shows the mean date on which swallows first arrived in one area of the UK, given as the day of the year (day 1 is 1 January).

Calculate the mean change in the first arrival date per decade between 1970 and 2020.

Line graph of mean first arrival date in day of the year (y-axis, 85 to 115) against year (x-axis, 1970 to 2020). The line joins the points (1970, 110), (1980, 107), (1990, 103), (2000, 99), (2010, 96), (2020, 93).

Model answer

Change = 110 − 93 = 17 days earlier
Number of decades = (2020 − 1970) ÷ 10 = 5
Mean change = 17 ÷ 5 = 3.4 days earlier per decade

Explanation

Find the total change, then divide by the number of decades (5, not 6: there are six points but only five intervals between them). This rate shows how quickly the migration pattern is changing.

Mark scheme
  1. 1 mark

    (110 − 93) ÷ 5

    an answer of 3.4 (days earlier per decade) scores 2 marks; allow 17 ÷ 5

  2. 1 mark

    3.4 (days earlier per decade)

    allow −3.4; allow ecf from misread values

Question 2

3 marks

Describe three biological consequences of global warming.

Model answer

Global warming causes loss of habitat, for example sea ice melting in the Arctic. It changes the distribution of species, as some species move towards the poles or further up mountains. It also changes migration patterns, and biodiversity is reduced as some species cannot survive the changes.

Explanation

The specification lists loss of habitat, changes in the distribution of species, changes in migration patterns and reduced biodiversity. Giving an example for each shows understanding rather than just a list.

Mark scheme
  1. 1 mark

    loss of habitat (e.g. melting ice, rising sea levels flooding coastal habitats)

    max 3

  2. 1 mark

    changes in the distribution of species (e.g. species moving towards the poles or uphill)

  3. 1 mark

    changes in migration patterns (e.g. birds arriving earlier or not migrating)

  4. 1 mark

    reduced biodiversity / some species becoming extinct

  5. 1 mark

    pests or pathogens spreading to new areas

Question 3

3 marks

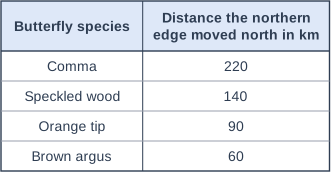
Scientists recorded how far north the northern edge of the range of four butterfly species in the UK moved between 1970 and 2010.

The table shows their results.

Explain how these data show a biological consequence of global warming.

Table with columns "Butterfly species", "Distance the northern edge moved north in km". Butterfly species: Comma; Distance the northern edge moved north in km: 220 | Butterfly species: Speckled wood; Distance the northern edge moved north in km: 140 | Butterfly species: Orange tip; Distance the northern edge moved north in km: 90 | Butterfly species: Brown argus; Distance the northern edge moved north in km: 60.

Model answer

The northern edge of the range of all four species moved north, by between 60 km and 220 km. As the climate warms, areas further north become warm enough for these butterflies to survive and breed, so the species spread northwards. This shows a change in the distribution of species, one of the biological consequences of global warming.

Explanation

Many species can only live within a certain range of temperatures. As the climate warms, the places that suit them shift towards the poles, so their distribution changes.

Mark scheme
  1. 1 mark

    the northern edge of the range of all four species moved north (by 60 to 220 km)

    must use data

  2. 1 mark

    as temperatures rise, areas further north become warm enough for the butterflies to survive / breed

  3. 1 mark

    so the distribution of the species has changed

    allow species are moving to follow suitable conditions

Question 4

4 marks

Scientists are trying to predict how global warming will affect the distribution of species. Some of their evidence is uncertain or incomplete.

Explain why the evidence about the biological consequences of global warming is uncertain or incomplete.

Model answer

Ecosystems are very complex, with many biotic and abiotic factors interacting. A species' distribution can also change because of habitat loss, pollution or new predators and pathogens, so it is hard to separate the effect of warming from these other factors. Reliable records for many species only go back a few decades, and only some species and places have been studied. Conditions also vary naturally from year to year, so long-term trends take many years to detect.

Explanation

In a complex context, many variables change at once and cannot be controlled as in a laboratory experiment. This is why scientists rely on large amounts of data from many studies and accept that some predictions remain uncertain.

Mark scheme
  1. 1 mark

    ecosystems are complex, with many interacting biotic and abiotic factors

    max 4

  2. 1 mark

    other factors (e.g. habitat loss, pollution, new predators or pathogens) also change species' distribution, so it is hard to separate the effect of warming

  3. 1 mark

    records of many species only go back a short time / only some species and places have been studied

  4. 1 mark

    conditions vary naturally from year to year, so long-term trends take many years to detect

  5. 1 mark

    predictions rely on models that make assumptions / the future amount of warming is not known

Ready to try the rest? Every answer you write is marked against the mark scheme, so you can see exactly where the marks are.

Revision notes

Global warming

The big idea

The levels of carbon dioxide and methane in the atmosphere are increasing, and both gases contribute to global warming: a rise in the Earth's mean (average) temperature. Organisms are adapted to the conditions where they live, so when temperature and rainfall change, they must move, adapt or die out. In the exam you need to describe these biological consequences.

Why the levels of the gases are rising

GasMain sources from human activities
Carbon dioxideBurning fossil fuels (coal, oil and gas); deforestation (burning and decay of the trees, and less photosynthesis); burning or draining peat
MethaneCattle (released as they digest their food); flooded rice fields; waste decaying in landfill sites

How the gases cause warming

Carbon dioxide and methane are greenhouse gases.

  1. Energy from the Sun warms the Earth's surface.
  2. The warm surface gives off energy as heat (infrared radiation).
  3. Greenhouse gases absorb some of this heat, so less energy escapes into space.
  4. The more greenhouse gas there is, the more heat is kept in, so the Earth's mean temperature rises.

This greenhouse effect is natural and keeps the Earth warm enough for life; adding more of the gases makes it stronger. The hole in the ozone layer is a separate problem and does not cause global warming.

Flow chart of 5 boxes joined by arrows, read from left to right. The first box is "Burning fuels, deforestation", which leads to "More CO₂ and methane", which leads to "More heat absorbed", which leads to "Mean temperature rises", which leads to "Habitats lost, species move" (shaded).
A strong answer links each step to the next, from human activity to the effect on living things.

Biological consequences

  • Loss of habitat. Ice melts and sea levels rise, flooding low-lying land such as salt marshes and small islands. Polar bears hunt seals from sea ice, so as the ice melts they catch fewer seals.
  • Changes in the distribution of species. Where temperature or rainfall changes, species move to places that now suit them, usually further from the equator or higher up mountains. Species that live only on mountain tops have nowhere higher to go.
  • Changes in migration patterns. Some birds arrive earlier in spring, or stop migrating, as the timing of their food supply changes.
  • Changes in timing. Many plants flower and animals breed earlier, so some animals may no longer match the timing of their food supply.
  • Spread of pests and disease. Mosquitoes, which carry the protist that causes malaria, can survive and breed in areas that used to be too cold for them.
  • Reduced biodiversity. Species that cannot move or adapt quickly enough become extinct. Warmer seas can kill corals, destroying reefs that thousands of other species depend on.
  • Changes in food production. Crop yields may rise in cool regions, where photosynthesis is faster and the growing season longer, but fall where it becomes too hot, or where droughts or floods become more common.

Using evidence

Graphs often show the carbon dioxide level and the temperature rising together. A correlation on its own does not prove that one causes the other, because other factors change at the same time. Scientists are confident the link is real because there is a clear mechanism (greenhouse gases absorb heat) and many independent studies agree.

Calculating a percentage increase

The mean carbon dioxide concentration at a measuring station was 339 parts per million (ppm) in 1980 and 414 ppm in 2020. Calculate the percentage increase. Give your answer to 2 significant figures.

Increase: \(414 - 339 = 75\) ppm

Percentage increase: \(\dfrac{75}{339} \times 100 = 22.1\%\)

To 2 significant figures: 22%

Always divide by the starting value (1980), not the final one.

Food arriving at the wrong time

Example data from one wood: in 1990, the caterpillars that great tits feed to their chicks were most plentiful on 30 May, and most chicks hatched on 28 May. In 2020, the caterpillars peaked on 18 May and the chicks hatched on 25 May. Explain why fewer chicks may survive in 2020.

Caterpillar peak: \(30 - 18 = 12\) days earlier. Hatching: \(28 - 25 = 3\) days earlier.

In 1990 the chicks hatched 2 days before the caterpillar peak; in 2020 they hatched 7 days after it.

Warmer springs make the oak leaves, and the caterpillars that eat them, appear earlier, but the birds' breeding has moved forward much less. When the chicks need the most food, there are fewer caterpillars, so fewer chicks are fed enough to survive.

Remember

  • Carbon dioxide and methane are the greenhouse gases whose levels are increasing.
  • They absorb heat given off by the Earth, so less escapes into space and the mean temperature rises.
  • Consequences: loss of habitat, changes in the distribution of species, changes in migration patterns, and reduced biodiversity.

Common mistakes

  • Linking global warming to the hole in the ozone layer. They are different problems: global warming is caused by greenhouse gases.
  • Saying greenhouse gases "trap the Sun's rays" or UV. They absorb heat (infrared) given off by the Earth's surface.
  • Writing "animals will die" with no reason. Name the consequence and how it happens, for example "sea ice melts, so polar bears lose their hunting habitat".
  • Dividing by the final value when working out a percentage increase.
  • Saying a graph "proves" that carbon dioxide causes warming. A correlation alone does not prove cause.

Exam tip

For "describe the biological consequences" questions, give several different consequences, each with an example, rather than one idea repeated. In a 6-mark question that also asks about the causes, write the chain in order: activity, gas, heat absorbed, temperature rise, effect on habitats and species, loss of biodiversity.

Study Helper Hints first, answers after you try

Stuck on this one? Ask for a hint and I’ll point you in the right direction, without giving the answer away. Once you’ve checked your answer, I’ll show you how the marks are awarded.