Level:
Correct: 0
Incorrect: 0
Marks: 0/0
Exam Practice
Course:
Topics:
Avg
score:
–
Topics
done:
0/35

Communities

Practise 17 exam-style questions on Communities for AQA GCSE Combined Science (Biology Paper 2). Write your answer as you would in the exam and get it marked in seconds against the mark scheme, point by point, with the Study Helper on hand if you get stuck.

  • 17 questions
  • 1–6 marks each
  • Instant marking
  • No sign-up needed
17 questions, marked as you go

Sample questions with model answers

Here are 4 of the questions in this topic, each with a model answer, an explanation of why it earns the marks and the mark scheme an examiner would use.

Question 1

2 marks

Describe what is meant by an ecosystem.

Model answer

An ecosystem is the interaction of a community of living organisms (the biotic part) with the non-living (abiotic) parts of their environment, such as the soil, water and air.

Explanation

The key word is interaction: an ecosystem includes both the living community and the non-living environment and how they affect each other. Just listing the organisms in an area describes a community, not an ecosystem.

Mark scheme
  1. 1 mark

    the interaction of a community of living organisms (biotic)

    allow all the organisms in an area

  2. 1 mark

    with the non-living (abiotic) parts of their environment

    allow named abiotic parts, e.g. soil, water, air, light

Question 2

2 marks

Describe what is meant by a stable community.

Model answer

A stable community is one in which all the species and environmental factors are in balance, so the population sizes remain fairly constant.

Explanation

In a stable community populations still rise and fall a little, for example in predator-prey cycles, but they stay around the same level over time. Examples include tropical rainforests and ancient oak woodlands.

Mark scheme
  1. 1 mark

    all the species and environmental factors are in balance

  2. 1 mark

    so population sizes remain fairly constant

    allow population sizes stay roughly the same over time; do not accept populations never change

Question 3

3 marks

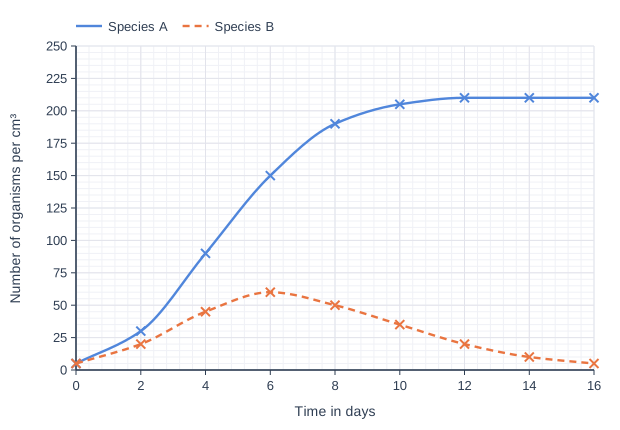
Two species of single-celled organism, A and B, both feed on bacteria. Scientists grew A and B together in a container with a fixed amount of food added each day.

The graph shows the results.

Explain the change in the population of species B after day 6.

Line graph of number of organisms per cm³ (y-axis, 0 to 250) against time in days (x-axis, 0 to 16). "Species A" is a smooth curve through (0, 5), (2, 30), (4, 90), (6, 150), (8, 190), (10, 205), (12, 210), (14, 210), (16, 210). "Species B" (dashed) is a smooth curve through (0, 5), (2, 20), (4, 45), (6, 60), (8, 50), (10, 35), (12, 20), (14, 10), (16, 5).

Model answer

After day 6 the population of B fell from about 60 to about 5 per cm³. A and B compete for the same food, bacteria. Species A was the better competitor: its population grew much larger, so it took most of the food, and too few B could get enough food to survive and reproduce.

Explanation

When two species need the same limited resource, the more successful competitor can reduce the other species' numbers. Competition is one of the main ways organisms in a community interact.

Mark scheme
  1. 1 mark

    the population of B fell (from about 60 to about 5 per cm³)

    max 3; allow 55-65 and 0-10

  2. 1 mark

    A and B compete for the same food (bacteria)

  3. 1 mark

    A is the better competitor / A's population was much larger, so A got most of the food

    allow A outcompetes B

  4. 1 mark

    so too few of B could get enough food to survive and reproduce

Question 4

4 marks

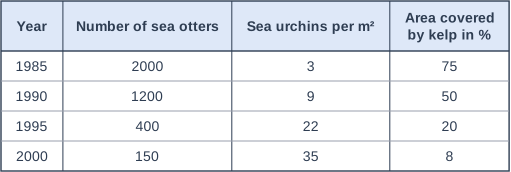
Sea otters eat sea urchins. Sea urchins eat kelp, a large seaweed. Kelp forests provide food and shelter for many species of fish.

The table shows data collected in one coastal area.

Use the data to explain why sea otters are important to the whole kelp forest community.

Table with columns "Year", "Number of sea otters", "Sea urchins per m²", "Area covered by kelp in %". Year: 1985; Number of sea otters: 2000; Sea urchins per m²: 3; Area covered by kelp in %: 75 | Year: 1990; Number of sea otters: 1200; Sea urchins per m²: 9; Area covered by kelp in %: 50 | Year: 1995; Number of sea otters: 400; Sea urchins per m²: 22; Area covered by kelp in %: 20 | Year: 2000; Number of sea otters: 150; Sea urchins per m²: 35; Area covered by kelp in %: 8.

Model answer

Between 1985 and 2000 the number of sea otters fell from 2000 to 150, and the number of sea urchins rose from 3 to 35 per m², because fewer urchins were being eaten. The extra urchins ate more kelp, so the area covered by kelp fell from 75% to 8%. Many fish depend on kelp for food and shelter, so they would decrease too. The otters therefore affect the whole community.

Explanation

This shows interdependence: removing one species can affect the whole community. The otters do not eat kelp, but by controlling the urchins they protect the kelp and everything that depends on it.

Mark scheme
  1. 1 mark

    as the number of sea otters decreased, the number of sea urchins increased (from 3 to 35 per m²)

    max 4; must use data for full marks

  2. 1 mark

    because fewer urchins were eaten by otters

  3. 1 mark

    more urchins ate more kelp, so the area covered by kelp fell (from 75% to 8%)

  4. 1 mark

    the fish that depend on kelp for food and shelter would decrease, so the otters affect the whole community (interdependence)

Ready to try the rest? Every answer you write is marked against the mark scheme, so you can see exactly where the marks are.

Revision notes

Communities

The big idea

No organism lives on its own. The plants, animals and microorganisms in an area depend on each other and on their surroundings, and they also compete with each other for the things they need. This topic is about how life in an area is organised, what organisms compete for, and why losing just one species can change a whole community.

From one organism to a whole ecosystem

Ecologists describe living things at different levels of organisation. Each level contains the one before it. A habitat is the place where an organism lives.

LevelMeaningExample on a rocky shore
IndividualOne organismOne limpet
PopulationAll the organisms of one species living in a habitatAll the limpets on the shore
CommunityThe populations of all the different species living and interacting in a habitatThe limpets, mussels, crabs, seaweeds and every other species on the shore
EcosystemThe interaction of a community of living organisms (biotic) with the non-living (abiotic) parts of their environmentThe shore community together with the rock, sea water, light and temperature

What organisms need and compete for

To survive and reproduce, organisms need a supply of materials from their surroundings and from the other living organisms there. A plant takes in carbon dioxide from the air, and water and mineral ions from the soil. An animal takes in oxygen and water from its surroundings, and gets its food by eating other organisms.

When a resource is in short supply, organisms compete for it:

  • Plants compete with each other for light and space, and for water and mineral ions from the soil.
  • Animals compete with each other for food, mates and territory.

Competition is usually strongest between members of the same species, because they need exactly the same resources. To suggest what organisms are competing for in a given habitat, look for a resource that both of them need and that is limited, such as nest sites on a crowded cliff or light on a shady woodland floor. Organisms also have adaptations that suit them to the conditions where they live (see also: Adaptations).

Interdependence and stable communities

Within a community, each species depends on other species for things such as food, shelter, pollination and seed dispersal. Bumblebees feed on nectar and carry pollen between wild flowers; jays bury acorns to eat later, and the ones they forget grow into new oak trees. If one species is removed, it can affect the whole community. This is called interdependence.

A stable community is one where all the species and environmental factors are in balance, so that population sizes remain fairly constant. The populations still rise and fall a little from year to year, but they stay around the same level.

A rocky shore food web. Food web of 8 organisms in 4 rows, joined by arrows. Bottom row (left to right): Seaweed and Phytoplankton. Second row from the bottom (left to right): Limpets, Mussels and Barnacles. Third row from the bottom (left to right): Crabs and Dog whelks. Top row: Herring gulls. Arrows point from Seaweed to Limpets; from Phytoplankton to Mussels and Barnacles; from Limpets to Crabs; from Mussels to Crabs, Dog whelks and Herring gulls; from Barnacles to Dog whelks; from Crabs to Herring gulls. Each arrow points from the organism that is eaten to the organism that eats it, showing the direction in which energy and biomass are transferred. Producers (trophic level 1): Seaweed and Phytoplankton. Primary consumers (trophic level 2, herbivores): Limpets, Mussels and Barnacles. Secondary consumers (trophic level 3, carnivores): Crabs and Dog whelks. Herring gulls (trophic level 4, carnivore): a secondary consumer when eating Mussels and a tertiary consumer when eating Crabs. Nothing in the web eats Dog whelks or Herring gulls. It contains 5 food chains: Seaweed → Limpets → Crabs → Herring gulls; Phytoplankton → Mussels → Crabs → Herring gulls; Phytoplankton → Mussels → Herring gulls; Phytoplankton → Mussels → Dog whelks; Phytoplankton → Barnacles → Dog whelks.
Each arrow points from the organism that is eaten to the organism that eats it.

Following a change through a food web

A disease kills most of the mussels on the shore in the food web above. Explain how this could affect the number of limpets.

  1. Crabs eat mussels, so the crabs now have less food.
  2. The crabs eat more limpets instead.
  3. So more limpets are eaten and the limpet population falls.

Later, if the crabs cannot find enough food, fewer crabs survive and breed, so fewer limpets are eaten and the limpets may recover. Notice that limpets do not eat mussels: they are affected only because they share a predator with them.

Using data about competition

Under a parent oak tree, 4 out of 50 young oak seedlings survived for two years. In an open field nearby, 31 out of 50 survived. Calculate the percentage that survived in each place and explain the difference.

Under the tree: \(\dfrac{4}{50} \times 100 = 8\%\)

In the open: \(\dfrac{31}{50} \times 100 = 62\%\)

Under the parent tree, the seedlings compete with it for light, water and mineral ions. Its canopy absorbs most of the light, so the seedlings photosynthesise less, make less glucose for growth and most of them die. This is why seed dispersal by animals such as jays helps the oak.

Remember

  • Individual, population, community, ecosystem: each level contains the one before it.
  • Plants compete for light, space, water and mineral ions; animals compete for food, mates and territory.
  • Interdependence: each species depends on others for food, shelter, pollination and seed dispersal, so removing one species can affect the whole community.
  • A stable community has its species and environmental factors in balance, so population sizes stay fairly constant.

Common mistakes

  • Calling all the organisms of one species a community. They form a population; a community contains many different species.
  • Describing an ecosystem as just a place, or just the organisms. It is the living community interacting with the non-living parts of the environment.
  • Saying plants compete for "food" from the soil. Plants make their own glucose by photosynthesis; they compete for light, space, water and mineral ions.
  • Saying two different species compete for mates. Only members of the same species can breed together.
  • Thinking a stable community means populations never change. They still fluctuate, but around a steady level.

Exam tip

When a question removes or adds a species, follow the food web one step at a time and say which way each population changes and why, linking each step with "so". When you are given a table or graph, quote values with their units to back up each point.

Study Helper Hints first, answers after you try

Stuck on this one? Ask for a hint and I’ll point you in the right direction, without giving the answer away. Once you’ve checked your answer, I’ll show you how the marks are awarded.