
Level:
Correct: 0
Incorrect: 0
Marks: 0/0
Exam Practice
Course:
Topics:
Edexcel GCSE Maths (Foundation non-calculator) Smart practice A mixed round aimed at your weak spots
Unit 1
Number
Unit 2
Algebra
Unit 3
Ratio, proportion and rates of change
Unit 4
Geometry and measures
Unit 5
Probability
Unit 6
Statistics
Avg
score:
–
Topics
done:
0/86

Using statistics to describe a population

Practise 18 exam-style questions on Using statistics to describe a population for Edexcel GCSE Maths (Foundation non-calculator). Write your answer as you would in the exam and get it marked in seconds against the mark scheme, point by point, with the Study Helper on hand if you get stuck.

  • 18 questions
  • 1–5 marks each
  • Instant marking
  • No sign-up needed
18 questions, marked as you go

Sample questions with model answers

Here are 4 of the questions in this topic, each with a model answer, an explanation of why it earns the marks and the mark scheme an examiner would use.

Question 1

1 mark

In a town, the mean number of children in each family is 1.8

Jo says,
"That cannot be right. A family cannot have 0.8 of a child."

Explain why Jo is wrong.

Model answer

The mean is found by sharing the total number of children equally between all the families. This does not have to give a whole number, even though each family has a whole number of children.

Explanation

A mean describes the population as a whole: it is the total divided by the number of families. For example, 9 children shared between 5 families gives a mean of 1.8. No family has 1.8 children, but the mean is still correct.

Mark scheme
  1. 1 mark

    B1 for a correct explanation, e.g. the mean is the total number of children divided by the number of families, so it does not have to be a whole number

    oe; accept 'the mean does not have to be one of the data values'
Question 2

2 marks

Amy wants to find out how often the people in her town exercise.
She asks 10 people at her gym.
8 of them say they exercise every day.

Amy says,
"Most people in my town exercise every day."

Give two reasons why Amy's conclusion may not be correct.

Model answer

1. A sample of 10 people is too small to describe a whole town.
2. The sample is biased: people at a gym are likely to exercise more than most people, so they do not represent the town.

Explanation

To describe a population, a sample needs to be big enough and representative of the population. Asking only people at a gym gives answers that are not typical of everyone in the town.

Mark scheme
  1. 1 mark

    B1 for the sample is too small (only 10 people)

    oe; correct answer with no working scores full marks

  2. 1 mark

    B1 for the sample is biased, e.g. people at a gym are more likely to exercise than other people in the town

    oe

Question 3

3 marks

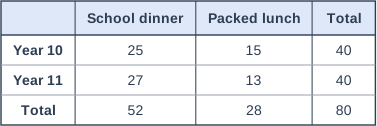
The two-way table shows information about the lunches of a random sample of 80 students from a school.

There are 1200 students in the school.

Estimate the number of students in the school who have a packed lunch.

Table with columns (row headings), "School dinner", "Packed lunch", "Total". Year 10; School dinner: 25; Packed lunch: 15; Total: 40 | Year 11; School dinner: 27; Packed lunch: 13; Total: 40 | Total; School dinner: 52; Packed lunch: 28; Total: 80.

Model answer

Packed lunch in the sample: 15 + 13 = 28 out of 80
1200 ÷ 80 = 15
28 × 15 = 420 students

Explanation

Use the total column for packed lunch, 28 out of 80. The whole school is 15 times the size of the sample, so the estimate is 15 times 28. The answer is an estimate because it assumes the sample is representative.

Mark scheme
  1. 1 mark

    B1 for 28 as the number in the sample who have a packed lunch

    may be implied; correct answer with no working scores full marks

  2. 1 mark

    M1 for \(\dfrac{28}{80}\) × 1200 oe

    ft their 28; e.g. 1200 ÷ 80 = 15 and 15 × 28

  3. 1 mark

    A1 for 420

    cao

Question 4

4 marks

Zara wants to estimate the number of fish in a lake.

She catches 30 fish. She puts a mark on each fish and puts them back in the lake.
A week later she catches 40 fish. 8 of these fish have a mark.

Work out an estimate for the number of fish in the lake.
Write down one assumption you have made.

Model answer

In the second catch, 8 out of 40 are marked: \(\dfrac{8}{40} = \dfrac{1}{5}\)
So the 30 marked fish are about \(\dfrac{1}{5}\) of all the fish in the lake.
Number of fish ≈ 30 × 5 = 150
Assumption: the number of fish in the lake stayed the same during the week.

Explanation

The second sample tells you what fraction of the whole lake is marked. If one fifth of the fish are marked, and there are 30 marked fish, then there are about 5 × 30 = 150 fish. This only works if the population does not change and the marked fish have spread out among the others.

Mark scheme
  1. 1 mark

    M1 for \(\dfrac{8}{40}\) (= \(\dfrac{1}{5}\)) as the fraction of fish that are marked, or 40 ÷ 8 (= 5)

    correct answer with no working scores full marks

  2. 1 mark

    M1 for 30 × 5 or 30 ÷ \(\dfrac{1}{5}\) oe

  3. 1 mark

    A1 for 150

    cao

  4. 1 mark

    B1 for a correct assumption, e.g. the number of fish in the lake does not change (no fish are born, die, or are added or taken away); the marked fish mix fully with the others; the marks do not come off

Ready to try the rest? Every answer you write is marked against the mark scheme, so you can see exactly where the marks are.

Study Helper Hints first, answers after you try

Stuck on this one? Ask for a hint and I’ll point you in the right direction, without giving the answer away. Once you’ve checked your answer, I’ll show you how the marks are awarded.