Practise 36 exam-style questions on Averages and range for Edexcel GCSE Maths (Foundation non-calculator). Write your answer as you would in the exam and get it marked in seconds against the mark scheme, point by point, with the Study Helper on hand if you get stuck.
36 questions
1–5 marks each
Instant marking
No sign-up needed
20 questions, marked as you go
Sample questions with model answers
Here are 4 of the questions in this topic, each with a model answer, an explanation of why it earns the marks and the mark scheme an examiner would use.
Question 1
1 mark
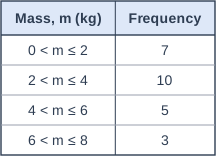
The table shows information about the masses of 25 parcels.
Bill uses the midpoints of the classes to work out the mean mass of the parcels.
Explain why Bill's answer can only be an estimate.
Model answer
The table only shows how many parcels are in each class, not the exact masses. Bill assumes every parcel in a class has the mass of the midpoint, which is probably not true, so his mean is only an estimate.
Explanation
Grouped data loses the exact values. Using the midpoint assumes the values in each class balance out around the middle of the class, which may not be true, so the mean found this way is an estimate.
Mark scheme
1 mark
B1 for a correct explanation, e.g. we do not know the exact mass of each parcel, only which class it is in, so the midpoints may not be the real values
oe
Question 2
2 marks
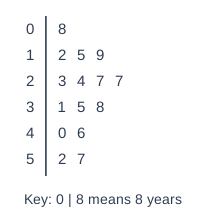
The stem and leaf diagram shows the ages, in years, of the people at a party.
Write down the mode. Work out the range.
Model answer
Mode: 27 appears twice, more than any other age, so the mode is 27 years. Range: 57 − 8 = 49 years
Explanation
The mode is the value that appears most often - look for a repeated leaf in the same row. The range is the largest value subtract the smallest: the first leaf on the top row and the last leaf on the bottom row. Read the key to put stems and leaves together correctly.
Mark scheme
1 mark
B1 for mode 27
cao; correct answer with no working scores full marks
1 mark
B1 for range 49
cao
Question 3
3 marks
Jake has taken 5 tests. His mean score is 16.
His scores in four of the tests are
12 19 14 17
Work out his score in the other test.
Model answer
Total of all 5 scores: 5 × 16 = 80 Total of four scores: 12 + 19 + 14 + 17 = 62 Other score: 80 − 62 = 18
Explanation
If you know the mean and how many values there are, you can find the total: mean × number of values. Subtract the four scores you know from this total to find the missing score. Check: (62 + 18) ÷ 5 = 16.
Mark scheme
1 mark
M1 for 5 × 16 (= 80)
1 mark
M1 for 80 − (12 + 19 + 14 + 17) oe
ft their 80
1 mark
A1 for 18
cao; correct answer with no working scores full marks
Question 4
4 marks
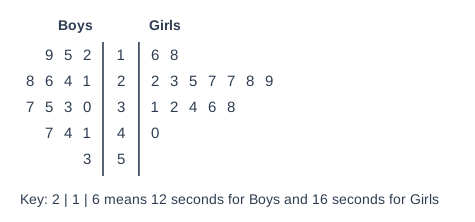
The back-to-back stem and leaf diagram shows the times, in seconds, that 15 boys and 15 girls took to solve a puzzle.
Compare the distributions of the times for the boys and the girls.
Model answer
Boys: median = 8th value = 30 seconds; range = 53 − 12 = 41 seconds Girls: median = 8th value = 28 seconds; range = 40 − 16 = 24 seconds The girls' median is lower, so on average the girls solved the puzzle faster. The girls' range is smaller, so the girls' times were more consistent.
Explanation
To compare two distributions, compare an average (here the median) and a measure of spread (the range), and say what each one means in context. A lower time means faster, so be careful with the direction. Saying only "the girls' median is lower" without explaining what it means will not get the communication marks.
Mark scheme
1 mark
B1 for both medians: boys 30 and girls 28
correct answer with no working scores full marks
1 mark
B1 for both ranges: boys 41 and girls 24
1 mark
C1 for a correct comparison of the medians in context, e.g. on average the girls were faster (their median time is lower)
ft their medians
1 mark
C1 for a correct comparison of the ranges in context, e.g. the girls' times were more consistent (their range is smaller)
ft their ranges
Ready to try the rest? Every answer you write is marked against the mark scheme, so you can see exactly where the marks are.
Ctrl + Enter to check
Study HelperHints first, answers after you try
Stuck on this one? Ask for a hint and I’ll point you in the right direction, without giving the answer away. Once you’ve checked your answer, I’ll show you how the marks are awarded.