Practise 18 exam-style questions on Sampling and populations for Edexcel GCSE Maths (Foundation non-calculator). Write your answer as you would in the exam and get it marked in seconds against the mark scheme, point by point, with the Study Helper on hand if you get stuck.
18 questions
1–5 marks each
Instant marking
No sign-up needed
18 questions, marked as you go
Sample questions with model answers
Here are 4 of the questions in this topic, each with a model answer, an explanation of why it earns the marks and the mark scheme an examiner would use.
Question 1
1 mark
Tom wants to find out how often people in his town exercise. He asks 40 people at a gym in his town.
Give a reason why Tom's sample may be biased.
Model answer
People at a gym are likely to exercise more than most people in the town, so his sample will not represent everyone in the town.
Explanation
A sample is biased if some types of people are more likely to be chosen than others. Asking people at a gym leaves out everyone who does not go to a gym, so Tom's results will make the town look more active than it really is.
Mark scheme
1 mark
B1 for a correct reason, e.g. people at a gym are likely to exercise more often than other people in the town, so the sample does not represent the whole town
accept 'only people who go to the gym are asked' oe; do not accept 'the sample is too small' on its own
Question 2
2 marks
Amy and Ben both want to find out the favourite flavour of crisps of the students at their school. Amy asks 10 students. Ben asks 100 students.
Whose results are likely to be more reliable? Give a reason for your answer.
Model answer
Ben's results. He has asked a much larger sample (100 students), so his results are more likely to represent all the students at the school.
Explanation
Small samples can easily give unusual results by chance. The bigger the sample, the closer its results are likely to be to the results for the whole population, as long as the sample is not biased.
Mark scheme
1 mark
B1 for Ben
correct values with no working score the calculation marks
1 mark
C1 for a correct reason, e.g. Ben has a larger sample, so it is more likely to represent the whole school
accept 'he asked more people' oe
Question 3
3 marks
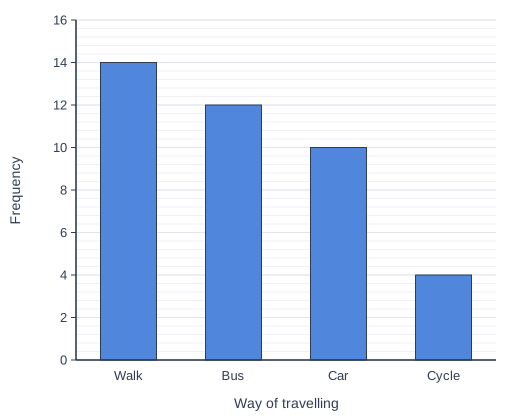
Sophie asked a sample of 40 students at her school how they travel to school. The bar chart shows her results.
There are 800 students at the school.
Work out an estimate for the number of students at the school who travel by bus.
Model answer
Bus in the sample: 12 out of 40 Estimate = \(\dfrac{12}{40}\) × 800 = 800 ÷ 40 × 12 = 20 × 12 = 240
Explanation
Read the bus bar: 12 of the 40 students in the sample travel by bus. The school has 800 ÷ 40 = 20 times as many students as the sample, so multiply 12 by 20. This assumes the sample represents the whole school.
Mark scheme
1 mark
M1 for reading 12 from the bar chart for bus
may be seen in a fraction such as \(\dfrac{12}{40}\)
1 mark
M1 for \(\dfrac{12}{40} \times 800\) oe, e.g. 800 ÷ 40 × 12
ft their reading for bus
1 mark
A1 for 240
cao; correct answer with no working scores full marks
Question 4
4 marks
The table shows information about a sample of students taken from Year 7 and a sample taken from Year 8 at a school.
Use the samples to estimate which year group has more students with a pet. You must show your working.
Model answer
Year 7: \(\dfrac{15}{40}\) × 240 = 240 ÷ 40 × 15 = 6 × 15 = 90 Year 8: \(\dfrac{20}{50}\) × 210 = 0.4 × 210 = 84 90 is more than 84, so Year 7 is likely to have more students with a pet.
Explanation
Use each sample to estimate the number of students with a pet in the whole year group. Year 8 has a slightly higher fraction with a pet (40% compared with 37.5%), but Year 7 has more students, so it has the larger estimated number. Comparing the fractions alone answers a different question.
Mark scheme
1 mark
M1 for \(\dfrac{15}{40} \times 240\) oe
e.g. 240 ÷ 40 × 15
1 mark
M1 for \(\dfrac{20}{50} \times 210\) oe
e.g. 0.4 × 210
1 mark
A1 for 90 and 84
1 mark
C1 for Year 7, supported by 90 and 84
'Year 8' from comparing only the fractions in the samples (37.5% and 40%) scores 0
Ready to try the rest? Every answer you write is marked against the mark scheme, so you can see exactly where the marks are.
Ctrl + Enter to check
Study HelperHints first, answers after you try
Stuck on this one? Ask for a hint and I’ll point you in the right direction, without giving the answer away. Once you’ve checked your answer, I’ll show you how the marks are awarded.