Practise 28 exam-style questions on Frequency trees and probability experiments for Edexcel GCSE Maths (Foundation non-calculator). Write your answer as you would in the exam and get it marked in seconds against the mark scheme, point by point, with the Study Helper on hand if you get stuck.
28 questions
1–5 marks each
Instant marking
No sign-up needed
20 questions, marked as you go
Sample questions with model answers
Here are 4 of the questions in this topic, each with a model answer, an explanation of why it earns the marks and the mark scheme an examiner would use.
Question 1
1 mark
Nadia drops a drawing pin 120 times. It lands point up 30 times.
Nadia drops the drawing pin once more. Estimate the probability that it lands point up.
Model answer
\(\dfrac{30}{120} = \dfrac{1}{4}\)
Explanation
The best estimate of a probability from an experiment is the relative frequency: the number of times it happened ÷ the number of trials. Here that is 30 ÷ 120, which simplifies to \(\frac{1}{4}\).
Mark scheme
1 mark
B1 for \(\dfrac{30}{120}\)
oe, e.g. 1/4, 0.25 or 25%
Question 2
2 marks
Sam rolls an ordinary six-sided dice 300 times. He gets a six 120 times.
Sam says the dice is fair.
Is Sam right? Give a reason for your answer.
Model answer
For a fair dice you would expect about \(\dfrac{1}{6} \times 300 = 50\) sixes. Sam got 120 sixes, which is much more than 50. So Sam is probably not right: the dice seems to be biased towards six.
Explanation
If the dice were fair, each score would come up about \(\frac{1}{6}\) of the time. Compare what happened with what you would expect. 300 rolls is a lot of trials, so a big difference like 120 instead of 50 is strong evidence that the dice is biased.
Mark scheme
1 mark
B1 for the expected number of sixes, 300 ÷ 6 = 50, or for comparing \(\dfrac{120}{300}\) (= 0.4) with \(\dfrac{1}{6}\)
1 mark
C1 for No (the dice is probably biased), because 120 is much more than 50 oe
the conclusion must be supported by a correct comparison
Question 3
2 marks
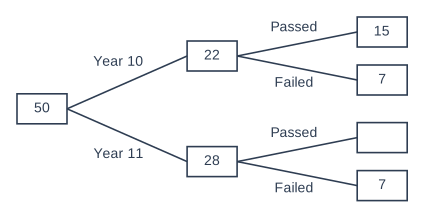
The frequency tree shows information about the test results of 50 students in Year 10 and Year 11.
How many of the 50 students passed the test?
Model answer
Year 11 students who passed: 28 − 7 = 21 Students who passed: 15 + 21 = 36
Explanation
First find the number in the empty box: 28 Year 11 students either passed or failed, so 28 − 7 = 21 passed. Then add the students who passed in each year group.
Mark scheme
1 mark
M1 for 28 − 7 (= 21 Year 11 students passed)
1 mark
A1 for 36
cao; correct answer with no working scores full marks
Question 4
3 marks
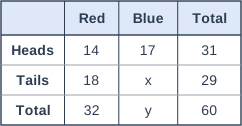
Holly spins a coin and a spinner together 60 times. The spinner lands on red or blue. The two-way table shows some of her results.
Work out the relative frequency of getting tails and blue.
Model answer
Tails and blue: x = 29 − 18 = 11 Relative frequency = \(\dfrac{11}{60}\)
Explanation
First find the missing number in the table: the Tails row adds up to 29, so tails and blue is 29 − 18 = 11. Then divide by the total number of trials, 60. Check with the Blue column: 17 + 11 = 28 = y.
Mark scheme
1 mark
P1 for x = 29 − 18 (= 11)
accept 28 − 17 from the totals
1 mark
M1 for their 11 over 60
1 mark
A1 for \(\dfrac{11}{60}\)
oe; correct answer with no working scores full marks
Ready to try the rest? Every answer you write is marked against the mark scheme, so you can see exactly where the marks are.
Ctrl + Enter to check
Study HelperHints first, answers after you try
Stuck on this one? Ask for a hint and I’ll point you in the right direction, without giving the answer away. Once you’ve checked your answer, I’ll show you how the marks are awarded.