Level:
Correct: 0
Incorrect: 0
Marks: 0/0
Exam Practice
Course:
Topics:
Edexcel GCSE Maths (Foundation non-calculator) Smart practice A mixed round aimed at your weak spots
Unit 1
Number
Unit 2
Algebra
Unit 3
Ratio, proportion and rates of change
Unit 4
Geometry and measures
Unit 5
Probability
Unit 6
Statistics
Avg
score:
–
Topics
done:
0/86

Scatter graphs and correlation

Practise 28 exam-style questions on Scatter graphs and correlation for Edexcel GCSE Maths (Foundation non-calculator). Write your answer as you would in the exam and get it marked in seconds against the mark scheme, point by point, with the Study Helper on hand if you get stuck.

  • 28 questions
  • 1–5 marks each
  • Instant marking
  • No sign-up needed
20 questions, marked as you go

Sample questions with model answers

Here are 4 of the questions in this topic, each with a model answer, an explanation of why it earns the marks and the mark scheme an examiner would use.

Question 1

1 mark

Ravi records the outside temperature and the amount of gas used to heat his house each day for a month.

What type of correlation would you expect between the outside temperature and the amount of gas used?

Model answer

When it is colder outside, more gas is used to heat the house.
So as the temperature goes up, the amount of gas used goes down: negative correlation.

Explanation

Think about what happens to one variable when the other increases. On warmer days the heating is used less, so higher temperatures go with less gas. When one goes up as the other goes down, the correlation is negative.

Mark scheme
  1. 1 mark

    B1 for negative (correlation)

Question 2

2 marks

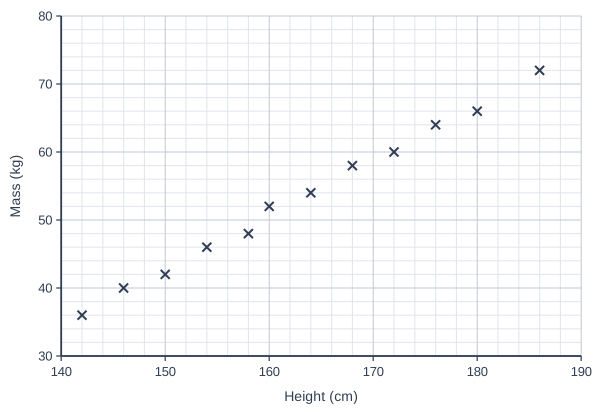
The scatter graph shows the heights and masses of 12 boys.

A boy is 170 cm tall.

Use a line of best fit to estimate the mass of this boy.

Scatter graph on a grid of small squares. The horizontal axis is "Height (cm)", from 140 to 190, numbered every 10, with 5 small squares between numbered values (each small square is 2). The vertical axis is "Mass (kg)", from 30 to 80, numbered every 10, with 5 small squares between numbered values (each small square is 2). 12 points are plotted as crosses: (142, 36), (146, 40), (150, 42), (154, 46), (158, 48), (160, 52), (164, 54), (168, 58), (172, 60), (176, 64), (180, 66) and (186, 72).

Model answer

A line of best fit goes through the middle of the points, from about (142, 36) to about (186, 72).
Going up from 170 cm to the line and across gives about 59 kg.

Explanation

A line of best fit is a straight line that follows the trend of the points, with about the same number of points on each side. Draw it in your head (or on paper), then read across from 170 cm. Because everyone's line is slightly different, answers in a range are accepted.

Mark scheme
  1. 1 mark

    M1 for a line of best fit (or a method using the trend of the points) used at 170 cm

    e.g. a value between 54 and 64; correct answer with no working scores full marks

  2. 1 mark

    A1 for an answer from 56 to 62 kg

Question 3

2 marks

A teacher finds that there is negative correlation between the number of hours her students spend on social media each week and their test marks.

Kim says,
"This proves that using social media makes students' test marks worse."

Is Kim correct?
Explain your answer.

Model answer

No. Correlation shows that the two things are linked, but it does not prove that one causes the other.
For example, students who spend a lot of time on social media may spend less time revising, and it is the lack of revision that lowers their marks.

Explanation

Correlation means two variables tend to change together. It does not tell you why. There could be another reason, such as time spent revising, that explains the pattern, so you cannot say one thing causes the other.

Mark scheme
  1. 1 mark

    C1 for 'No' (or 'not necessarily') with the reason that correlation does not prove causation

  2. 1 mark

    C1 for a sensible explanation, e.g. students who spend more time on social media may spend less time revising; another factor could cause both

    oe

Question 4

4 marks

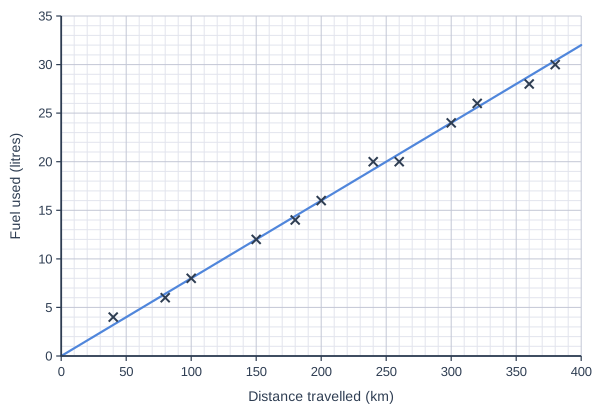
The scatter graph shows the distance travelled and the amount of fuel used on 12 car journeys.
A line of best fit has been drawn.

Ella is going to drive 250 km.
Fuel costs £1.50 per litre.

Use the line of best fit to estimate the cost of the fuel for Ella's journey.

Scatter graph on a grid of small squares. The horizontal axis is "Distance travelled (km)", from 0 to 400, numbered every 50, with 5 small squares between numbered values (each small square is 10). The vertical axis is "Fuel used (litres)", from 0 to 35, numbered every 5, with 5 small squares between numbered values (each small square is 1). 12 points are plotted as crosses: (40, 4), (80, 6), (100, 8), (150, 12), (180, 14), (200, 16), (240, 20), (260, 20), (300, 24), (320, 26), (360, 28) and (380, 30). A straight line of best fit is drawn; it passes through (0, 0) and (250, 20).

Model answer

Go up from 250 km to the line of best fit and across: about 20 litres.
Cost: 20 × £1.50 = £30

Explanation

First use the line of best fit to estimate how much fuel the journey needs. Then multiply the number of litres by the price of one litre. 20 × 1.50 is the same as 20 × 1 plus 20 × 0.5, which is 20 + 10 = £30.

Mark scheme
  1. 1 mark

    M1 for using the line of best fit at 250 km

    correct answer with no working scores full marks

  2. 1 mark

    A1 for 20 litres

    accept 19 to 21

  3. 1 mark

    M1 for their number of litres × 1.50

    ft their reading

  4. 1 mark

    A1 for £30

    ft their reading, e.g. accept £28.50 to £31.50

Ready to try the rest? Every answer you write is marked against the mark scheme, so you can see exactly where the marks are.

Study Helper Hints first, answers after you try

Stuck on this one? Ask for a hint and I’ll point you in the right direction, without giving the answer away. Once you’ve checked your answer, I’ll show you how the marks are awarded.