Level:
Correct: 0
Incorrect: 0
Marks: 0/0
Exam Practice
Course:
Topics:
Edexcel GCSE Maths (Foundation non-calculator) Smart practice A mixed round aimed at your weak spots
Unit 1
Number
Unit 2
Algebra
Unit 3
Ratio, proportion and rates of change
Unit 4
Geometry and measures
Unit 5
Probability
Unit 6
Statistics
Avg
score:
–
Topics
done:
0/86

Charts, tables and diagrams

Practise 36 exam-style questions on Charts, tables and diagrams for Edexcel GCSE Maths (Foundation non-calculator). Write your answer as you would in the exam and get it marked in seconds against the mark scheme, point by point, with the Study Helper on hand if you get stuck.

  • 36 questions
  • 1–5 marks each
  • Instant marking
  • No sign-up needed
20 questions, marked as you go

Sample questions with model answers

Here are 4 of the questions in this topic, each with a model answer, an explanation of why it earns the marks and the mark scheme an examiner would use.

Question 1

1 mark

The dual bar chart shows the numbers of hot drinks and cold drinks sold in a café from Monday to Friday.

On which day were more cold drinks sold than hot drinks?
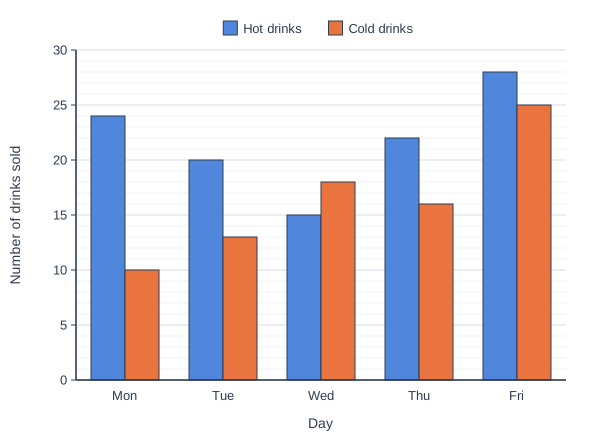
Dual bar chart of number of drinks sold for each day, comparing Hot drinks and Cold drinks (a key above the chart shows which bar is which). Mon: Hot drinks 24, Cold drinks 10; Tue: Hot drinks 20, Cold drinks 13; Wed: Hot drinks 15, Cold drinks 18; Thu: Hot drinks 22, Cold drinks 16; Fri: Hot drinks 28, Cold drinks 25.

Model answer

Wednesday: hot drinks 15, cold drinks 18
18 is more than 15, so more cold drinks than hot drinks were sold on Wednesday.
On every other day the hot drinks bar is taller.

Explanation

In a dual bar chart, compare the two bars for each day. The key tells you which colour is which. Wednesday is the only day where the cold drinks bar is taller than the hot drinks bar.

Mark scheme
  1. 1 mark

    B1 for Wednesday

    cao

Question 2

2 marks

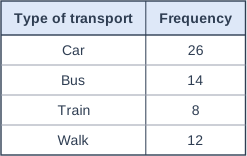
The table shows how 60 people travel to work.

Jan is drawing a pie chart to show this information.

Work out the angle of the sector for Bus.

Table with columns "Type of transport", "Frequency". Type of transport: Car; Frequency: 26 | Type of transport: Bus; Frequency: 14 | Type of transport: Train; Frequency: 8 | Type of transport: Walk; Frequency: 12.

Model answer

There are 360° in a full circle.
Each person: 360 ÷ 60 = 6°
Bus: 14 × 6 = 84°

Explanation

A pie chart shares 360° between all the people. Divide 360 by the total number of people to find the angle for one person, then multiply by the number in the group. Check that the angles for all the groups would add up to 360°.

Mark scheme
  1. 1 mark

    M1 for 360 ÷ 60 (= 6) or \(\dfrac{14}{60}\) × 360

  2. 1 mark

    A1 for 84°

    cao; correct answer with no working scores full marks

Question 3

3 marks

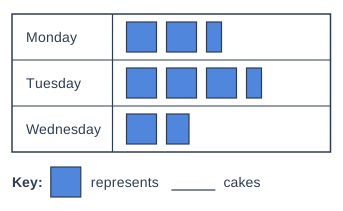
The pictogram shows the number of cakes a bakery sold on Monday, Tuesday and Wednesday.
The number in the key is missing.

The bakery sold 30 cakes on Monday.

How many cakes did the bakery sell on Wednesday?

Pictogram, a table with 3 rows of square symbols. Key: one square represents a number of cakes that is left blank. Monday: 2 and a half squares. Tuesday: 3 and a half squares. Wednesday: 1 and three quarters squares.

Model answer

Monday has 2½ squares, which is 30 cakes.
Half a square: 30 ÷ 5 = 6 cakes, so one square = 12 cakes.
Wednesday has 1¾ squares.
A quarter of a square = 3 cakes, so ¾ of a square = 9 cakes.
Wednesday: 12 + 9 = 21 cakes

Explanation

Use Monday to work out the key: 2½ squares stand for 30 cakes, so each half square is 6 cakes and a whole square is 12 cakes. Then read Wednesday's row using your key. Check your key makes sense for the part squares - a quarter of 12 is 3, a whole number of cakes.

Mark scheme
  1. 1 mark

    M1 for a method to find the value of one square, e.g. 30 ÷ 2.5 (= 12) or 2 squares + half a square = 30

  2. 1 mark

    M1 for a method to find Wednesday, e.g. 1.75 × 12 or 12 + 9

    ft their value of one square

  3. 1 mark

    A1 for 21

    cao; correct answer with no working scores full marks

Question 4

4 marks

Ravi asked 80 people to choose their favourite type of film.

25% chose comedy.
\(\dfrac{3}{8}\) chose action.
12 chose horror.
The rest chose cartoons.

Ravi is going to show the results in a pie chart.

Work out the angle of the sector for cartoons.

Model answer

Comedy: 25% of 80 = 20 people
Action: \(\frac{3}{8}\) of 80 = 30 people
Cartoons: 80 − 20 − 30 − 12 = 18 people
Each person: 360 ÷ 80 = 4.5°
Cartoons: 18 × 4.5 = 81°

Explanation

First find how many people chose each type, so you can find the number left for cartoons. Then change people to degrees: each person is 360 ÷ 80 = 4.5°. You could also work with angles all the way: 25% of 360° is 90° and \(\frac{3}{8}\) of 360° is 135°.

Mark scheme
  1. 1 mark

    P1 for finding the number who chose comedy (20) or action (30), or the angle for comedy (90°) or action (135°)

    correct answer with no working scores full marks

  2. 1 mark

    P1 for finding both comedy and action (20 and 30, or 90° and 135°)

  3. 1 mark

    P1 for the number who chose cartoons, 80 − 20 − 30 − 12 (= 18), or for 360 − 90 − 135 − 54

    angle for horror: 12 × 4.5 = 54°

  4. 1 mark

    A1 for 81°

    cao

Ready to try the rest? Every answer you write is marked against the mark scheme, so you can see exactly where the marks are.

Study Helper Hints first, answers after you try

Stuck on this one? Ask for a hint and I’ll point you in the right direction, without giving the answer away. Once you’ve checked your answer, I’ll show you how the marks are awarded.