Level:
Correct: 0
Incorrect: 0
Marks: 0/0
Exam Practice
Course:
Topics:
Edexcel GCSE Maths (Foundation non-calculator) Smart practice A mixed round aimed at your weak spots
Unit 1
Number
Unit 2
Algebra
Unit 3
Ratio, proportion and rates of change
Unit 4
Geometry and measures
Unit 5
Probability
Unit 6
Statistics
Avg
score:
–
Topics
done:
0/86

Gradient as a rate of change

Practise 28 exam-style questions on Gradient as a rate of change for Edexcel GCSE Maths (Foundation non-calculator). Write your answer as you would in the exam and get it marked in seconds against the mark scheme, point by point, with the Study Helper on hand if you get stuck.

  • 28 questions
  • 1–5 marks each
  • Instant marking
  • No sign-up needed
20 questions, marked as you go

Sample questions with model answers

Here are 4 of the questions in this topic, each with a model answer, an explanation of why it earns the marks and the mark scheme an examiner would use.

Question 1

1 mark

Jake walks from his home to a shop and then walks back home.
The graph shows his distance from home.

Between 30 minutes and 50 minutes the graph is horizontal.
What does this show about Jake?
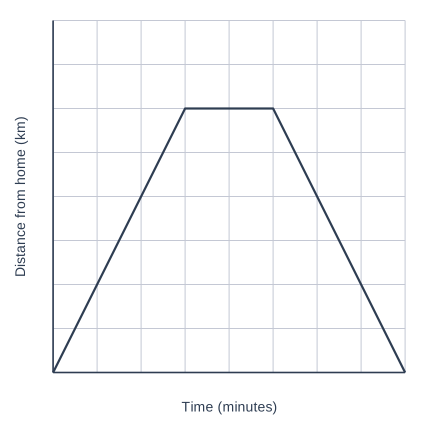
A graph of Distance from home (km) (vertical axis, 0 to 8, marked every 1) against Time (minutes) (horizontal axis, 0 to 80, marked every 10), on a grid. The graph is made of straight-line sections joining (0, 0), (30, 6), (50, 6) and (80, 0).

Model answer

Jake has stopped (he is at the shop). His distance from home does not change, so his speed is 0.

Explanation

A horizontal line on a distance-time graph has a gradient of 0. The distance from home stays the same while time passes, so Jake is not moving.

Mark scheme
  1. 1 mark

    B1 for he has stopped (is not moving)

    accept 'he is at the shop', 'his speed is 0', 'he stays 6 km from home' oe
Question 2

2 marks

Leah draws a distance-time graph for a cycle ride.
Distance is in kilometres and time is in minutes.

One part of the graph is a straight line with gradient 0.4

Work out Leah's speed during this part of the ride.
Give your answer in km/h.

Model answer

Gradient 0.4 means 0.4 km each minute.
There are 60 minutes in an hour.
0.4 × 60 = 24 km/h

Explanation

The gradient of a distance-time graph is the speed in (distance unit) per (time unit), so here it is 0.4 km per minute. To change to km per hour, multiply by 60 because there are 60 minutes in an hour.

Mark scheme
  1. 1 mark

    M1 for 0.4 × 60 oe

    recognising the gradient is 0.4 km per minute

  2. 1 mark

    A1 for 24 (km/h)

    cao; correct answer with no working scores full marks

Question 3

3 marks

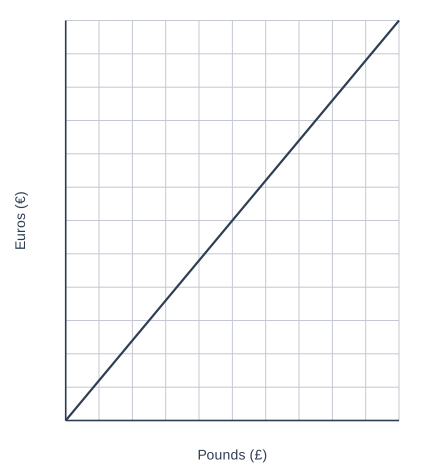
The conversion graph can be used to change between pounds (£) and euros (€).

Kai changes £350 into euros.

Use the graph to work out how many euros he gets.

A graph of Euros (€) (vertical axis, 0 to 120, marked every 10) against Pounds (£) (horizontal axis, 0 to 100, marked every 10), on a grid. The graph is a straight line joining (0, 0) and (100, 120).

Model answer

From the graph, £50 = €60.
£350 = 7 × £50
So £350 = 7 × €60 = €420

Explanation

£350 is off the end of the graph, so read a value you can see, such as £50 = €60, and scale it up. The graph is a straight line through the origin, so the number of euros is directly proportional to the number of pounds and scaling works. The gradient, 1.2, is the exchange rate: €1.20 for every £1.

Mark scheme
  1. 1 mark

    M1 for reading a correct pair from the graph, e.g. £50 = €60 or £100 = €120, or finding the rate 1.2 euros per pound

  2. 1 mark

    M1 for a complete method to convert £350, e.g. 120 × 3 + 60, or 350 × 1.2, or 60 × 7

  3. 1 mark

    A1 for €420

    cao; correct answer with no working scores full marks

Question 4

4 marks

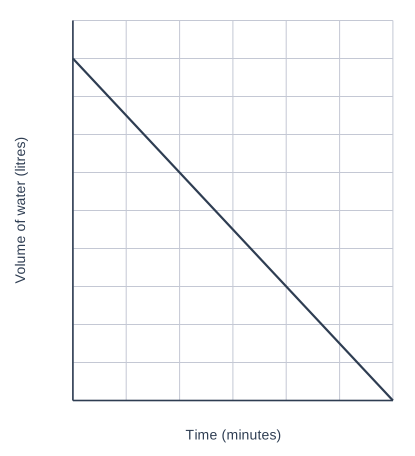
A pond holds 3600 litres of water.
The graph shows how the volume of water in the pond changes when it is emptied using pump A.

Pump B empties water at a rate of 30 litres per minute.

The pond is full. Pump A and pump B are both used at the same time to empty it.
How long does it take to empty the pond?

A graph of Volume of water (litres) (vertical axis, 0 to 4000, marked every 400) against Time (minutes) (horizontal axis, 0 to 60, marked every 10), on a grid. The graph is a straight line joining (0, 3600) and (60, 0).

Model answer

Pump A empties 3600 litres in 60 minutes.
Rate of pump A = 3600 ÷ 60 = 60 litres per minute
Together: 60 + 30 = 90 litres per minute
Time = 3600 ÷ 90 = 40 minutes

Explanation

The gradient of the graph gives the rate of pump A. When both pumps work together their rates add, so 90 litres leave the pond every minute. Then divide the volume by the combined rate. Do not add the times or average them.

Mark scheme
  1. 1 mark

    P1 for the rate of pump A: 3600 ÷ 60 = 60 (litres per minute)

  2. 1 mark

    P1 for 60 + 30 = 90 (litres per minute)

    ft their rate for pump A

  3. 1 mark

    P1 for 3600 ÷ 90

    ft their combined rate

  4. 1 mark

    A1 for 40 minutes

    cao; correct answer with no working scores full marks

Ready to try the rest? Every answer you write is marked against the mark scheme, so you can see exactly where the marks are.

Study Helper Hints first, answers after you try

Stuck on this one? Ask for a hint and I’ll point you in the right direction, without giving the answer away. Once you’ve checked your answer, I’ll show you how the marks are awarded.