Level:
Correct: 0
Incorrect: 0
Marks: 0/0
Exam Practice
Course:
Topics:
Edexcel GCSE Maths (Foundation non-calculator) Smart practice A mixed round aimed at your weak spots
Unit 1
Number
Unit 2
Algebra
Unit 3
Ratio, proportion and rates of change
Unit 4
Geometry and measures
Unit 5
Probability
Unit 6
Statistics
Avg
score:
–
Topics
done:
0/86

Real-life and non-standard graphs

Practise 28 exam-style questions on Real-life and non-standard graphs for Edexcel GCSE Maths (Foundation non-calculator). Write your answer as you would in the exam and get it marked in seconds against the mark scheme, point by point, with the Study Helper on hand if you get stuck.

  • 28 questions
  • 1–5 marks each
  • Instant marking
  • No sign-up needed
20 questions, marked as you go

Sample questions with model answers

Here are 4 of the questions in this topic, each with a model answer, an explanation of why it earns the marks and the mark scheme an examiner would use.

Question 1

1 mark

Ella cycled from her home to her friend's house, stayed for a while and then cycled home.

The travel graph shows her journey.

Did Ella cycle faster on the way to her friend's house or on the way home?
Give a reason for your answer.
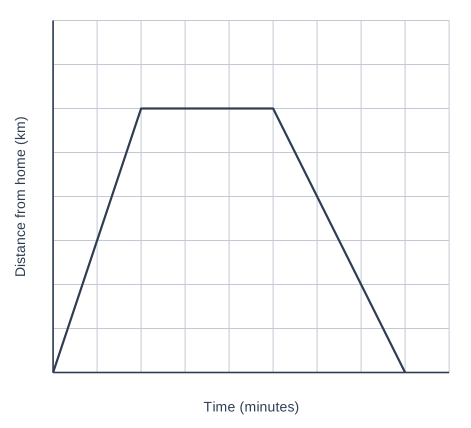
A graph of Distance from home (km) (vertical axis, 0 to 8, marked every 1) against Time (minutes) (horizontal axis, 0 to 90, marked every 10), on a grid. The graph is made of straight-line sections; its values can be read from the grid.

Model answer

Going there: 6 km in 20 minutes.
Coming home: 6 km in 30 minutes.
She cycled faster on the way to her friend's house, because she covered the same distance in less time (that part of the graph is steeper).

Explanation

On a distance-time graph, the steeper the line, the faster the speed. Both parts of the journey are 6 km, so the part that took less time was faster. The line going down shows Ella travelling back towards home, not slowing down.

Mark scheme
  1. 1 mark

    B1 for 'on the way to her friend's house' with a correct reason, e.g. 'she took 20 minutes to go 6 km there but 30 minutes to come back' or 'that part of the graph is steeper'

    accept correct speeds: 18 km/h there and 12 km/h back
Question 2

2 marks

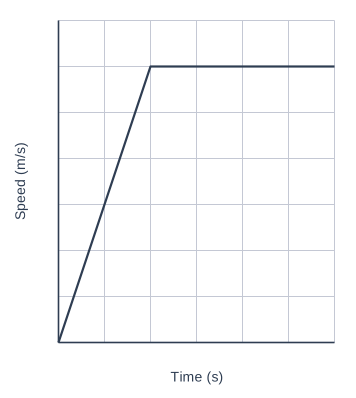
The speed-time graph shows the first 60 seconds of a train's journey.

Work out the acceleration of the train in the first 20 seconds.

A graph of Speed (m/s) (vertical axis, 0 to 35, marked every 5) against Time (s) (horizontal axis, 0 to 60, marked every 10), on a grid. The graph is made of straight-line sections; its values can be read from the grid.

Model answer

Acceleration = change in speed ÷ time
= 30 ÷ 20
= 1.5 m/s²

Explanation

Acceleration is how much the speed increases each second, which is the gradient of a speed-time graph. The speed goes from 0 to 30 m/s in 20 seconds, so it increases by 1.5 m/s every second. The units are metres per second per second, written m/s².

Mark scheme
  1. 1 mark

    M1 for 30 ÷ 20

  2. 1 mark

    A1 for 1.5 (m/s²)

    oe, e.g. \(\frac{3}{2}\); correct answer with no working scores full marks

Question 3

2 marks

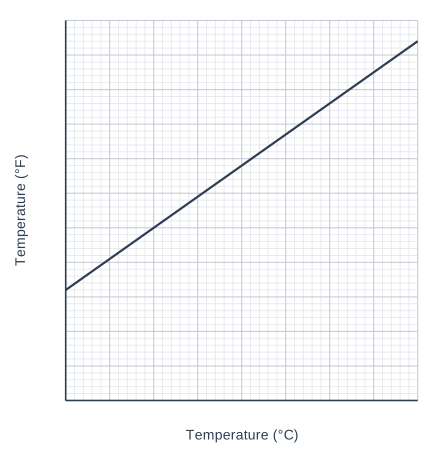
You can use the graph to change between temperatures in degrees Celsius (°C) and degrees Fahrenheit (°F).

One day the temperature in Lisbon was 20 °C and the temperature in New York was 64 °F.

Which city was warmer? You must show how you get your answer.

A graph of Temperature (°F) (vertical axis, 0 to 110, marked every 10) against Temperature (°C) (horizontal axis, 0 to 40, marked every 5), on a grid with 5 small squares to each large square. The graph is a straight line; its values can be read from the grid.

Model answer

From the graph, 20 °C = 68 °F.
68 °F is more than 64 °F.
Lisbon was warmer.

Explanation

You can only compare temperatures in the same units, so use the graph to change one of them. Notice the line does not start at 0: 0 °C is 32 °F, so you cannot just double or halve values. Each small square on the °F axis is 2 degrees.

Mark scheme
  1. 1 mark

    B1 for 20 °C = 68 °F (accept 67 to 69) or 64 °F = 18 °C (accept 17 to 19)

  2. 1 mark

    C1 for Lisbon, supported by a correct conversion

Question 4

4 marks

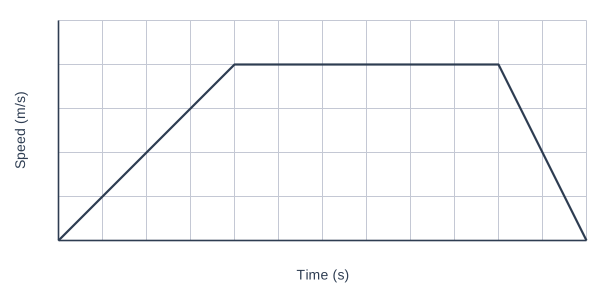
The speed-time graph shows a motorbike's journey between two junctions.

Is the motorbike's acceleration at the start greater than its deceleration at the end?
You must show your working.

A graph of Speed (m/s) (vertical axis, 0 to 25, marked every 5) against Time (s) (horizontal axis, 0 to 24, marked every 2), on a grid. The graph is made of straight-line sections; its values can be read from the grid.

Model answer

Acceleration (0 to 8 s): 20 ÷ 8 = 2.5 m/s²
Deceleration (20 to 24 s): 20 ÷ 4 = 5 m/s²
No. The deceleration at the end (5 m/s²) is greater than the acceleration at the start (2.5 m/s²).

Explanation

Acceleration and deceleration are the gradients of the sloping parts of a speed-time graph: the change in speed divided by the time taken. The motorbike loses 20 m/s in only 4 seconds at the end, but takes 8 seconds to gain 20 m/s at the start. The steeper line has the bigger value.

Mark scheme
  1. 1 mark

    M1 for a correct method for the acceleration or the deceleration, e.g. 20 ÷ 8 or 20 ÷ 4

  2. 1 mark

    A1 for acceleration 2.5 (m/s²)

  3. 1 mark

    A1 for deceleration 5 (m/s²)

  4. 1 mark

    C1 for No, the deceleration (5 m/s²) is greater than the acceleration (2.5 m/s²)

    ft their values if M1 awarded

Ready to try the rest? Every answer you write is marked against the mark scheme, so you can see exactly where the marks are.

Study Helper Hints first, answers after you try

Stuck on this one? Ask for a hint and I’ll point you in the right direction, without giving the answer away. Once you’ve checked your answer, I’ll show you how the marks are awarded.