Level:
Correct: 0
Incorrect: 0
Marks: 0/0
Practice
Course:
Topics:
Year 8 Maths Smart practice A mixed round aimed at your weak spots
Unit 1
Number: accuracy, powers and standard form
Unit 2
Fractions, decimals and percentages
Unit 3
Algebraic expressions
Unit 4
Equations, inequalities and formulae
Unit 5
Sequences and graphs
Unit 6
Ratio, proportion and rates of change
Unit 7
Circles, area and volume
Unit 8
Angles and constructions
Unit 9
Transformations and symmetry
Unit 10
Probability
Unit 11
Statistics
Avg
score:
–
Topics
done:
0/50

Scatter graphs and correlation

Practise 25 questions on Scatter graphs and correlation for Year 8 Maths. Write your answer and get it marked in seconds against the mark scheme, point by point, with the Study Helper on hand if you get stuck.

  • 25 questions
  • 1–5 marks each
  • Instant marking
  • No sign-up needed
20 questions, marked as you go

Sample questions with model answers

Here are 4 of the questions in this topic, each with a model answer, an explanation of why it earns the marks and the mark scheme.

Question 1

1 mark

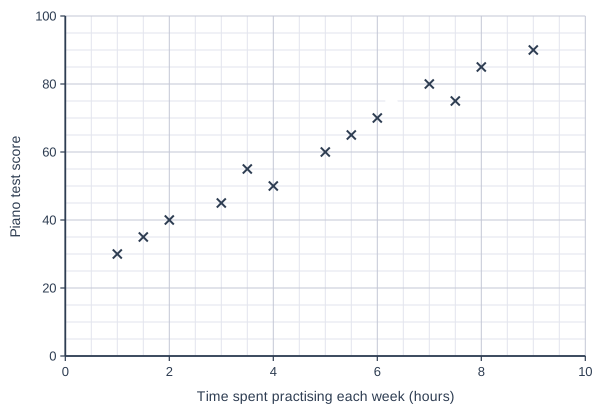
The scatter graph shows how long some pupils practised the piano each week and their scores in a piano test. The point labelled B shows Bella's results.

What score did Bella get in the piano test?

Scatter graph on a grid of small squares. The horizontal axis is "Time spent practising each week (hours)", from 0 to 10, numbered every 2, with 4 small squares between numbered values (each small square is 0.5). The vertical axis is "Piano test score", from 0 to 100, numbered every 20, with 4 small squares between numbered values (each small square is 5). 13 points are plotted as crosses: (1, 30), (1.5, 35), (2, 40), (3, 45), (3.5, 55), (4, 50), (5, 60), (5.5, 65), (7, 80), (7.5, 75), (8, 85) and (9, 90), plus a point labelled B. (The labelled point's coordinates can be read from the grid.)

Model answer

Point B is level with 70 on the vertical axis.
Bella scored 70.

Explanation

Read across from point B to the vertical axis, which shows the test score. Each small square on that axis is 5 marks, so B is at 70. A common mistake is to read the horizontal axis instead, which shows that Bella practised for 6 hours.

Mark scheme
  1. 1 mark

    70

    Do not accept 6 (the number of hours Bella practised) or 75. A correct answer with no working scores full marks.

Question 2

2 marks

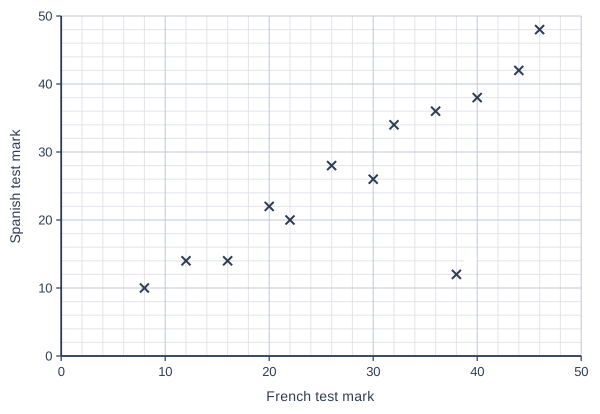
Thirteen pupils did a French vocabulary test and a Spanish vocabulary test. The scatter graph shows their marks. The point P is an outlier.

Write down the French mark and the Spanish mark of the pupil shown by P. Explain why P is an outlier.

Scatter graph on a grid of small squares. The horizontal axis is "French test mark", from 0 to 50, numbered every 10, with 5 small squares between numbered values (each small square is 2). The vertical axis is "Spanish test mark", from 0 to 50, numbered every 10, with 5 small squares between numbered values (each small square is 2). 13 points are plotted as crosses: (8, 10), (12, 14), (16, 14), (20, 22), (22, 20), (26, 28), (30, 26), (32, 34), (36, 36), (40, 38), (44, 42) and (46, 48), plus a point labelled P. (The labelled point's coordinates can be read from the grid.)

Model answer

P is at (38, 12): French mark 38, Spanish mark 12.
The other pupils with a French mark of about 38 got about 36 in Spanish.
P does not fit the pattern, so it is an outlier.

Explanation

Most pupils got similar marks in the two tests, so the points form an upward pattern. Point P shows a pupil who did well in French but badly in Spanish, far below the pattern. That is what makes it an outlier. Perhaps that pupil was ill on the day of the Spanish test.

Mark scheme
  1. 1 mark

    French mark 38 and Spanish mark 12

    Both needed. Accept (38, 12).

  2. 1 mark

    P does not fit the pattern of the other points: this pupil has a high French mark but a much lower Spanish mark than other pupils with similar French marks

    Accept "it is far away from the trend / the other points". A complete correct reason on its own scores this mark; the first mark is for the two marks read from the graph.

Question 3

3 marks

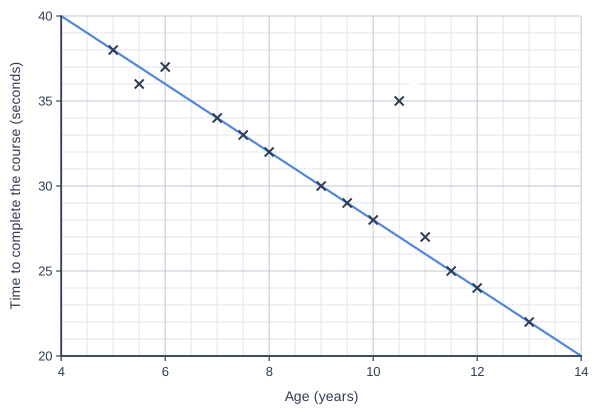
At a summer fun day, 14 children of different ages each did an obstacle course. The scatter graph shows the age of each child and the time they took. A line of best fit has been drawn. Point J shows Jo, who tripped over during the course.

Use the line of best fit to estimate the time for a child of the same age as Jo. How much slower than this estimate was Jo?

Scatter graph on a grid of small squares. The horizontal axis is "Age (years)", from 4 to 14, numbered every 2, with 4 small squares between numbered values (each small square is 0.5). The vertical axis is "Time to complete the course (seconds)", from 20 to 40, numbered every 5, with 5 small squares between numbered values (each small square is 1). 14 points are plotted as crosses: (5, 38), (5.5, 36), (6, 37), (7, 34), (7.5, 33), (8, 32), (9, 30), (9.5, 29), (10, 28), (11, 27), (11.5, 25), (12, 24) and (13, 22), plus a point labelled J. (The labelled point's coordinates can be read from the grid.) A straight line of best fit is drawn; it passes through (4, 40) and (14, 20).

Model answer

Point J: age 10.5 years, 35 seconds.
The line at 10.5 years: about 27 seconds.
\(35 - 27 = 8\)
Jo was about 8 seconds slower than the estimate.

Explanation

First read Jo's point: 10.5 years across and 35 seconds up. Then go up from 10.5 years to the line and across: about 27 seconds, which is the time the line predicts. Jo took 8 seconds longer, probably because of the fall. The line slopes down because older children tend to be quicker.

Mark scheme
  1. 1 mark

    Reads Jo's point: age 10.5 years and a time of 35 seconds; or the correct answers 27 seconds and 8 seconds with no working

  2. 1 mark

    Estimate from the line at 10.5 years: 27 seconds (accept from 26 to 28)

  3. 1 mark

    Jo was about 8 seconds slower

    Follow through 35 minus their estimate. Accept from 7 to 9 seconds. A correct answer with no working scores full marks.

Question 4

4 marks

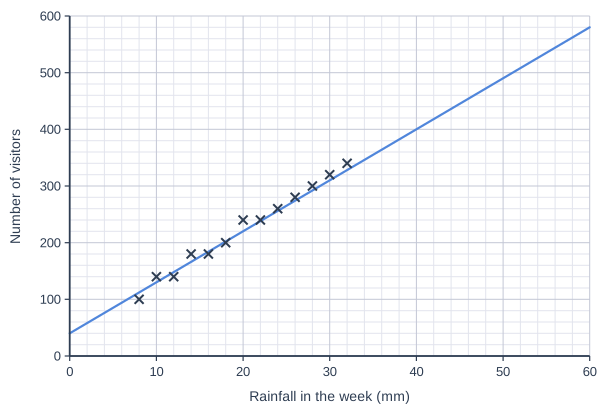
An indoor play centre recorded the rainfall in each of 13 weeks and its number of visitors that week. The scatter graph shows the results, with a line of best fit.

Use the line to estimate the number of visitors in a week with 20 mm of rain, and in a week with 50 mm of rain.

Which of your two estimates is more reliable? Explain why.

Scatter graph on a grid of small squares. The horizontal axis is "Rainfall in the week (mm)", from 0 to 60, numbered every 10, with 5 small squares between numbered values (each small square is 2). The vertical axis is "Number of visitors", from 0 to 600, numbered every 100, with 5 small squares between numbered values (each small square is 20). 13 points are plotted as crosses: (8, 100), (10, 140), (12, 140), (14, 180), (16, 180), (18, 200), (20, 240), (22, 240), (24, 260), (26, 280), (28, 300), (30, 320) and (32, 340). A straight line of best fit is drawn; it passes through (0, 40) and (60, 580).

Model answer

For 20 mm the line gives about 220 visitors.
For 50 mm the line gives about 490 visitors.
The estimate for 20 mm is more reliable.
The data goes from 8 mm to 32 mm, so 20 mm is inside the data but 50 mm is outside it.

Explanation

Both estimates come from the line, but they are not equally trustworthy. At 20 mm there is real data on both sides, so the line is a good guide. At 50 mm the line has been extended beyond the wettest week recorded, and the pattern might change: the centre could get full, or people might stay at home in very bad weather. Estimating outside the range of the data is risky.

Mark scheme
  1. 1 mark

    About 220 visitors for 20 mm (accept from 210 to 230)

  2. 1 mark

    About 490 visitors for 50 mm (accept from 480 to 500)

  3. 1 mark

    The estimate for 20 mm is more reliable, with a relevant but incomplete reason, e.g. "there are more points near 20 mm"

    "20 mm" on its own scores 0.

  4. 1 mark

    A complete correct reason: 20 mm is inside the range of the data (8 mm to 32 mm) but 50 mm is outside it, so we do not know that the pattern continues (for example, the play centre may get full)

    A complete correct reason on its own scores the last two marks. The two estimates with no working score the first two marks.

Ready to try the rest? Every answer you write is marked against the mark scheme, so you can see exactly where the marks are.

Topic notes

Scatter graphs and correlation

The big idea

Sometimes you measure two things about each person or object, such as the height and the shoe size of each pupil. This is called bivariate data (data about two variables). A scatter graph shows it as crosses, one for each person or object, so you can see whether the two things are linked.

Reading a scatter graph

Each cross shows one person or object. To read a cross, go straight down to the horizontal axis for one value, and straight across to the vertical axis for the other. Check the scale on each axis first: they are often different.

Correlation

Correlation describes the pattern made by the crosses.

Pattern of the crossesCorrelationIn words
going up from left to rightpositive correlationas one goes up, the other goes up
going down from left to rightnegative correlationas one goes up, the other goes down
no patternno correlationthe two are not linked

The correlation is strong when the crosses lie close to a straight line, and weak when they are spread out but still drift up or down.

A scatter graph of baskets scored out of 20 (vertical axis, 0 to 20) against height in cm (horizontal axis, 130 to 170) for 13 pupils. The crosses are at (132, 6), (136, 12), (138, 4), (142, 10), (144, 14), (148, 6), (150, 12), (154, 7), (156, 15), (160, 8), (162, 14), (166, 8) and (168, 13). They drift slightly upwards from left to right but are widely spread.
Weak positive correlation: taller pupils tend to score a little higher, but the crosses are spread out.

When you describe a relationship in words, name both things and say how one changes as the other changes.

A scatter graph of mistakes in a typing test (vertical axis, 0 to 40) against time practising on a typing app in hours (horizontal axis, 0 to 10) for 15 pupils. 14 crosses go down from left to right, close to a straight line: (0.5, 34), (1, 34), (1.5, 30), (2, 30), (3, 28), (3.5, 24), (4.5, 22), (5, 22), (5.5, 18), (6.5, 18), (7, 14), (8, 14), (8.5, 10) and (9.5, 8). The cross labelled A, at (7.5, 34), is far above the others. A line of best fit goes from (0, 36) to (10, 6).
15 pupils' practice times and their mistakes in a typing test, with a line of best fit. Point A is an outlier.

Sam says, "The graph shows that pupils who practise for longer make more mistakes." Is Sam right?

The crosses go down from left to right and lie close to a straight line, so there is strong negative correlation.

In words: the longer a pupil practised, the fewer mistakes they made. So Sam is not right: he has the relationship the wrong way round.

Outliers

An outlier is a point that does not fit the pattern of the others. Point A shows a pupil who practised for 7.5 hours but made 34 mistakes, when the pupils who practised for 7 and 8 hours made only 14. Perhaps they were ill on the day of the test. A point is not an outlier just because it is far from the others: if it follows the pattern, it fits.

Lines of best fit

A line of best fit is a straight line through the middle of the crosses, following the pattern. Outliers are left out when it is drawn. To estimate a value, go from the axis you know to the line, then across (or down) to the other axis.

Mo says, "A pupil who practises for 4 hours will make about 22 mistakes, because the nearest cross shows 22." Use the line of best fit to make a better estimate, and say why it is better.

Go up from 4 hours to the line, then across to the vertical axis: about 24 mistakes.

Mo's cross is for 4.5 hours, not 4, and one pupil can be a little above or below the pattern. The line follows the pattern of all the crosses, so it gives a better estimate.

Correlation does not prove cause

Two things can be correlated without one causing the other. Often a third thing causes both.

In a primary school, pupils with bigger feet tend to get higher reading scores. Does having bigger feet make you a better reader?

No. The data shows positive correlation, but correlation does not prove that one thing causes the other.

Older pupils have bigger feet, and older pupils have also had more years of reading practice. Age causes both.

Stretch: estimating beyond the data

The typing data only goes from 0.5 to 9.5 hours. Using the line outside this range assumes that the pattern carries on, and it may not. Carried on, the line reaches 0 mistakes at 12 hours and then gives negative numbers, which is impossible. Estimates inside the range of the data are more reliable.

Remember

  • Positive: both go up together. Negative: one goes up as the other goes down.
  • Strong: close to a straight line. Weak: spread out.
  • An outlier does not fit the pattern.
  • Read estimates from the line of best fit, not from a cross.
  • Correlation does not prove that one thing causes the other.

Common mistakes

  • Calling a downward pattern positive because the numbers on the axes are positive. Downward is negative.
  • Writing only "negative correlation" when asked for the relationship in words. Say how one thing changes as the other changes.
  • Calling a point an outlier just because it is far from the others. It is an outlier only if it does not fit the pattern.
  • Saying a trend is true every time: taller pupils tend to score more baskets, but not always.
  • Reading the wrong axis: check which axis shows the value you want.

Top tip

Describe correlation with a strength and a direction, such as "strong negative". Then add a sentence in words that names both things.

Study Helper Hints first, answers after you try

Stuck on this one? Ask for a hint and I’ll point you in the right direction, without giving the answer away. Once you’ve checked your answer, I’ll show you how the marks are awarded.